[Preprint]. 2025 Feb 12:rs.3.rs-5930673.
doi: 10.21203/rs.3.rs-5930673/v1.

Systems-Level Interactome Mapping Reveals Actionable Protein Network Dysregulation Across the Alzheimer's Disease Spectrum

Affiliations

Systems-Level Interactome Mapping Reveals Actionable Protein Network Dysregulation Across the Alzheimer's Disease Spectrum

Sadik Bay et al. Res Sq. .

Abstract

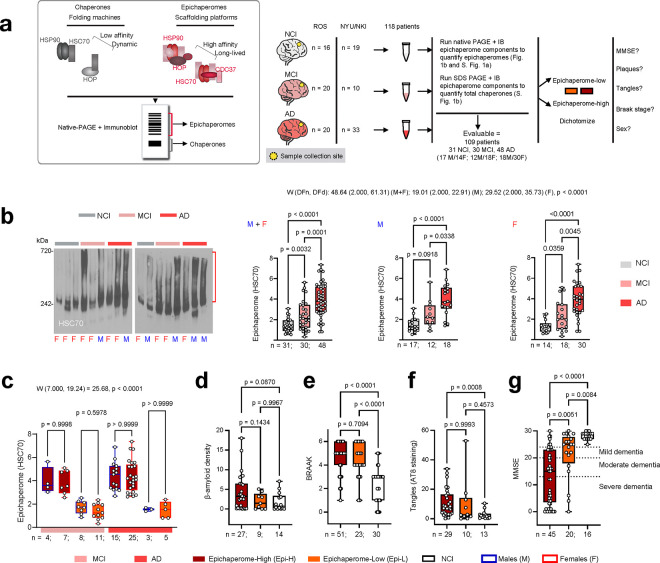
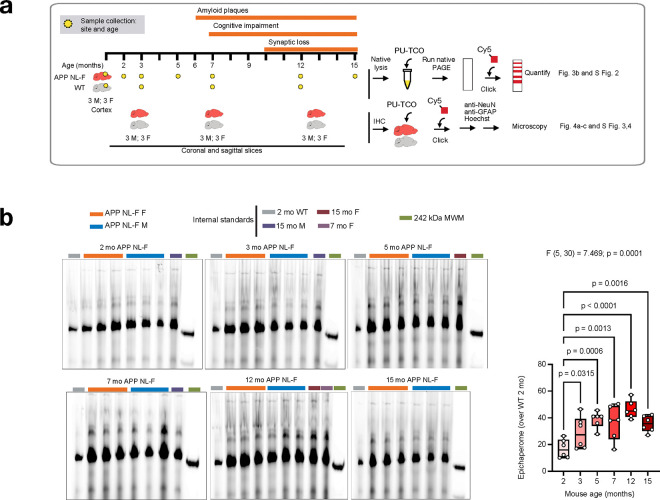
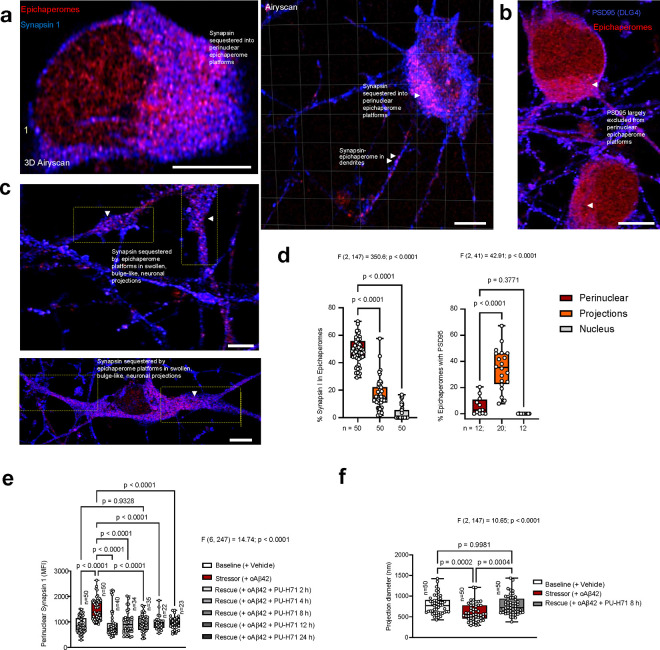
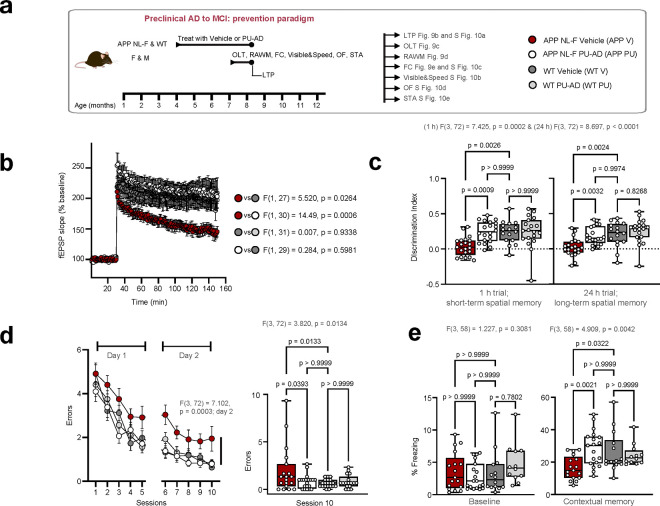
Alzheimer's disease (AD) progresses as a continuum, from preclinical stages to late-stage cognitive decline, yet the molecular mechanisms driving this progression remain poorly understood. Here, we provide a systems-level map of protein-protein interaction (PPI) network dysfunction across the AD spectrum and uncover epichaperomes-stable scaffolding platforms formed by chaperones and co-factors-as central drivers of this process. Using over 100 human brain specimens, mouse models, and human neurons, we show that epichaperomes emerge early, even in preclinical AD, and progressively disrupt multiple PPI networks critical for synaptic function and neuroplasticity. Glutamatergic neurons, essential for learning and memory, exhibit heightened vulnerability, with their dysfunction driven by protein sequestration into epichaperome scaffolds, independent of changes in protein expression. Notably, pharmacological disruption of epichaperomes with PU-AD restores PPI network integrity and reverses synaptic and cognitive deficits, directly linking epichaperome-driven network dysfunction to AD pathology. These findings establish epichaperomes as key mediators of molecular collapse in AD and identify network-centric intervention strategies as a promising avenue for disease-modifying therapies.


Conflict of interest statement

COMPETING INTERESTS Memorial Sloan Kettering Cancer Center holds the intellectual rights to the epichaperome portfolio. G.C., A.R. and S.S. are inventors on the licensed intellectual property. All other authors declare no competing interests.

Figures

Figure 1.
Figure 1.. Epichaperome formation emerges early in disease, persists across the AD continuum, and correlates with worse cognitive scores.
a Experimental design. The cartoon depicts the biochemical distinction between epichaperomes (oligomeric high-molecular weight assemblies with chaperones and co-chaperones nucleating on HSP90 and HSC70) and chaperones (smaller, dynamic assemblies). Due to this distinction, epichaperomes are separated using native PAGE, followed by visualization by immunoblotting with antibodies against epichaperome constituent chaperones (e.g., HSC70). Post-mortem frontal cortex samples from human brains spanning non-cognitively impaired (NCI), mild cognitive impairment (MCI), and Alzheimer’s Disease (AD) stages were assessed for epichaperome content. Patients were then categorized into epichaperome-high and epichaperome-low groups, and their Mini-Mental State Examination (MMSE), Braak stage, tangles, amyloid, and sex were compared across these groups. All data are plotted using a min-to-max box-and-whisker plot, with individual data points representing all values in the dataset. The box indicates the interquartile range, and the line within the box marks the median. Data were analyzed using Brown-Forsythe and Welch ANOVA with Dunnett’s T3 post-hoc test. b Epichaperome levels as in a, evaluated in NCI, MCI, and AD groups, with data shown for males (M) and females (F) combined, as well as separated by sex. Gel, representative patients profiles of the n = 108 evaluable samples. c Epichaperome levels as in a in MCI and AD patients divided into low- and high-epichaperome groups, with further separation by sex (male: M, female: F). d-g Amyloid (β-amyloid density), W (2.000, 26.69) = 2.720, p = 0.0841 (d), Braak score, W (2.000, 51.30) = 27.70, p < 0.0001 (e), tangles (AT8 staining), W (2.000, 19.95) = 8.456, p = 0.0022 (f), and MMSE scores, W (2.000, 37.31) = 53.22, p < 0.0001 (g), in epichaperome-high (MCI+AD), epichaperome-low (MCI+AD), and NCI groups. Graphs present individual values for each patient in these categories. Source data are provided as Source Data file.
Figure 2.
Figure 2.. Networks dysregulated by epichaperomes across the AD continuum.
a Schematic of the experimental design. The diagram illustrates the application of the dysfunctional Protein-Protein Interactome (dfPPI) method to analyze human brain specimens from NYU/NKI cohort including NCI, MCI, and AD, as well as PD samples for comparative control. This panel outlines the chemoproteomic approach used to identify and map the proteins and networks dysregulated by epichaperomes. b Reactome mapping of dfPPI results. This panel visualizes the pathways that are differentially enriched or disrupted across the AD continuum, with specific comparisons such as MCI vs. AD, AD vs. NCI and MCI vs. AD highlighted to show distinct shifts in protein enrichment and pathway engagement. c Map of dysregulated processes across the AD continuum displays the functional alterations driven by epichaperomes from early stages to late-stage disease. Each row represents a pathway, with major processes selected for representation to manage the complexity of the data. Refer to Supplementary Data 2 for complete datasets and analytics.
Figure 3.
Figure 3.. Epichaperome formation begins in the preclinical stages of Alzheimer’s disease.
a Study design to assess the spatiotemporal trajectory of epichaperome formation in AD-vulnerable brain regions of APP NL-F mice compared to control (WT) mice, with the aim of identifying anatomical and cellular vulnerability to epichaperome formation over time. Epichaperome levels were analyzed both in the cortex (via native PAGE separation and detection with PU-TCO clicked to Cy5 dye) and across the whole brain (using confocal microscopy on sagittal and coronal slices stained with PU-TCO clicked to Cy5 dye) at targeted age intervals. For native PAGE and immunodetection analysis, assessments were conducted at 2, 3, 5, 7, 12, and 15 months of age, with 3 males and 3 females per group, focusing on cortical regions associated with cognitive and synaptic vulnerability in AD. For microscopy-based analyses, coronal sections representing key AD-vulnerable regions (dentate gyrus, CA1, CA3, dorsal subiculum, entorhinal cortex, and frontal cortex) were examined at 3, 7, and 12–14 months of age in 3 male and 3 female mice per group. This design allowed for a detailed analysis of the spatiotemporal progression and regional specificity of epichaperome formation across AD-relevant stages in APP NL-F mice. b Trajectory of epichaperome levels in the APP NL-F mouse cortex across disease stages, evaluated via native PAGE separation and detection with PU-TCO clicked to Cy5 dye. See Supplementary Fig. 2 for WT mice. Data are plotted using a min-to-max box-and-whisker plot, with data points representing individual mice. The box indicates the interquartile range, and the line within the box marks the median. Data were analyzed using one-way ANOVA followed by the Two-stage linear step-up procedure of Benjamini, Krieger, and Yekutieli for multiple comparisons, with p < 0.05 considered significant. Source data are provided as a Source Data file.
Figure 4.
Figure 4.. Epichaperomes form in key AD-vulnerable brain cells and regions, progressively increasing in levels and spatial distribution as disease advances in APP NL-F mice.
a Epichaperome quantification in APP NL-F mice at 3, 7, and 12–14 months of age (3 females and 3 males per group) highlights their early formation and progressive accumulation in AD-vulnerable brain regions. Coronal brain slices stained with PU-TCO clicked to Cy5 dye, corresponding to Bregma −1.22 mm to −2.54 mm (Allen Brain Atlas, images 80–87), were analyzed across regions associated with memory and cognitive function. Data are presented with box and whiskers indicating the minimum to maximum range, with the interquartile range boxed and the median line indicated. Each data point represents an individual brain slice. Statistical analysis among regions within each age group was performed using Brown-Forsythe and Welch ANOVA (F*(DFn, DFd) = 12.56 (20.00, 160.3); p < 0.0001) with Dunnett’s post-hoc test. See also Supplementary Fig. 4,5. b Schematic illustration of the spatiotemporal trajectory of epichaperome formation in APP NL-F mice, showing highest early levels in the CA3 and dentate gyrus at 3 months, with CA1 following in intensity and dorsal subiculum, entorhinal cortex, and frontal cortex subsequently affected. Levels in all regions progressively increase by 7 months, with widespread, equally high levels across all regions by 12–14 months, suggesting a gradual progression from initial epichaperome formation in CA3 and DG toward CA1, dorsal subiculum, entorhinal cortex, and eventually the frontal cortex. Figure adapted using Allen brain, coronal slice image 85. c Representative sagittal slice of an APP NL-F mouse brain as in a stained with PU-TCO clicked to Cy5 dye, showing epichaperome formation. Inset 1 highlights the hippocampus, revealing strong epichaperome staining in the dentate gyrus (DG) and CA3-CA1 regions. Zoomed-in regions 2–4 show intense signal in glutamatergic neurons and surrounding astrocytes. GFAP marks astrocytes, NeuN labels neurons, and Hoechst marks nuclei. Source data are provided as a Source Data file.
Figure 5.
Figure 5.. Glutamatergic neurons form epichaperomes under Alzheimer’s disease-related stressors.
Micrographs display human iCell Glutamatergic Neurons (iGluts) treated with oligomeric Aβ42, highlighting the susceptibility of these neurons to epichaperome formation under Alzheimer’s disease-related stressors. The main images show widespread epichaperome presence throughout the neuronal soma and projections. Inset 1 emphasizes large perinuclear epichaperome platforms as well as the formation of nuclear platforms. Zoomed-in regions 2 and 3 detail epichaperome signals within axonal swellings and dendritic spines, respectively. Region 4, an additional zoom of region 3, is co-stained with PSD95 to further highlight the localization of epichaperomes in dendritic spines. Epichaperomes are marked by PU-TCO clicked to cy5 (red), neurons by anti-betaIII tubulin (green), and PSD95 is shown in blue. See also Supplementary Fig. 3 and 4. Micrographs are representative of 50 neurons from three independent experiments. Scale bars, 5 μm.
Figure 6.
Figure 6.. Impact of epichaperomes on synaptic function and plasticity across the AD continuum.
a Changes in specific proteins within pathways related to synaptic function and plasticity across the AD continuum, based on dysfunctional Protein-Protein Interactome (dfPPI) analysis. Blue bars represent proteins sequestered by epichaperomes in one comparison, while red bars indicate proteins that are less sequestered or not captured in subsequent stages, showing how the composition of proteins affected by epichaperomes evolves as the disease progresses from mild cognitive impairment through advanced stages of AD. dfPPI detected changes in PD and APP NL-F mice (15 mo F) and protein expression changes in AD detected by quantitative proteomics in bulk brain tissue (NeuroPro database) are shown for comparison. b Adapted KEGG glutamatergic synapse pathway illustrates synaptic proteins impacted by epichaperomes across the AD continuum. c The Venn diagram compares proteins identified by dfPPI as sequestered by epichaperomes in AD versus changes in protein expression in AD detected by quantitative proteomics in bulk brain tissue (NeuroPro database). This comparison highlights that protein sequestration into epichaperomes occurs independently of overall expression changes. See Supplementary Data 3,4 for complete datasets and analytics.
Figure 7.
Figure 7.. Epichaperomes sequester Synapsin 1 altering its physiological cellular location and distribution.
a,b Micrographs - representative of 50 neurons from three independent experiments - show human iCell Glutamatergic Neurons (iGlut neurons) treated with oligomeric Aβ42 (100 nM, 24 h), highlighting Synapsin 1 sequestration by epichaperomes into perinuclear platforms (a) and at aberrant neuronal projection sites (b). c PSD95, another important synaptic protein, is largely excluded from the large perinuclear epichaperome platforms. Epichaperomes are marked by PU-TCO clicked to Cy5 (red), while Synapsin 1 and PSD95 are shown in blue. Scale bars represent 5 μm. d Colocalization analysis of epichaperomes with Synapsin 1 and PSD95 in the specified neuronal regions, indicating their spatial association across these cellular regions. e,f Rescue: iGlut neurons were exposed to stressor (100 nM oligomeric Aβ42, 24 h) followed by treatment with an epichaperome disruptor (1 μM PU-H71, 2 to 24 h). d-f All data are plotted using a min-to-max box-and-whisker plot, where individual data points represent analyzed regions across 50 neurons for Synapsin 1 and 12 for PSD95 (d) and individual neurons for (e) and individual projections for (f) from 3 independent experiments. The box indicates the interquartile range, and the line within the box marks the median. Data were analyzed using one-way ANOVA with Sidak’s post-hoc test. See also Supplementary Fig. 9. Source data are provided as a Source Data file.
Figure 8.
Figure 8.. Temporal trajectory of synaptic networks dysregulated by epichaperomes in APP NL-F mice and human AD brains.
a Schematic of the experimental design. The diagram illustrates the application of the dysfunctional Protein-Protein Interactome (dfPPI) method to analyze brain specimens from APP NL-F mice at 7 months (early-stage cognitive decline) and 15 months (late-stage cognitive decline), as well as age-matched wild-type (WT) controls for comparison. b,c Reactome pathway analysis of dfPPI results in APP NL-F mice. The maps display the pathways dysrupted across the disease continuum, with b showing the shift in pathways between 7 and 15 months of age (APP 7mo F > APP 15mo F, reflecting changes in the MCI human disease) and c highlighting late-stage changes (APP 15mo F > APP 7mo F, reflecting changes observed in late-stage human AD). Specific synaptic pathways related to glutamatergic dysfunction in early stages (7mo) and additional disruptions involving inhibitory circuits, such as GABAergic signaling, in later stages (15mo) are highlighted. d Similar analysis in human AD patients, comparing epichaperome-high (EpiHigh) vs. epichaperome-low (EpiLow) cohorts. These results show broader synaptic dysfunction across multiple neuronal subtypes in patients with elevated epichaperome levels, underscoring the progressive nature of epichaperome-mediated network dysfunction in AD. Refer to Supplementary Data 5,6 for complete datasets and analytics.
Figure 9.
Figure 9.. PU-AD treatment prevents synaptic plasticity and memory deficits in APP NL-F mice.
a Schematic of the experimental design for APP NL-F (APP) and WT littermates treated with vehicle (V) or PU-AD (PU) as indicated. Treatment started at an age where the mice do not exhibit deficits (4 months of age), and continued for 3 months, until an age when the mice display moderate impairments (4 months of age). OLT, object location task; RAWM, radial arm water maze; FC, fear conditioning; OF, open field; STA, sensory threshold assessment; LTP, long-term potentiation. b LTP as in a measured as fEPSP slope (% baseline) over time in hippocampal slices from individual mice. LTP measures synaptic plasticity, with higher fEPSP slopes indicating stronger synaptic responses. Graph, mean ± s.e.m., two-way repeated measures (RM) ANOVA. Slices: n = 15 (3M,5F) for APP V; n = 17 (4M,3F) for APP PU; n = 14 (4M,5F) for WT V; and n = 19 (5M,6F) for WT PU. c Discrimination index (DI) in the OLT reflects the ability of individual mice to distinguish between moved and non-moved objects. Short-term spatial memory was determined as in a with a 1-hour interval between the learning and the test trial, and long-term spatial memory with a 24-hour interval between trials. Higher DI indicates better spatial memory. Mean ± s.e.m., one-way ANOVA with Bonferroni’s post-hoc, n = 21 (11M,10F) for APP V; n = 20 (11M,9F) for APP PU; n = 16 (9M,7F) for WT V; n = 19 (9M,10F) for WT PU. d RAWM performance, shown as mean ± s.e.m. errors made over sessions, evaluates short-term reference memory and spatial learning. Mice as in a were tested over two days, with performance assessed in 10 sessions, where fewer errors indicate improved memory and learning. Dara were analyzed via two-way RM ANOVA across all groups for day 2 and one-way ANOVA for block 10 with Bonferroni’s post-hoc, n = 19 (10M,9F) for APP V; n = 20 (10M,10F) for APP PU; n = 20 (11M,9F) for WT V; and n = 17 (9M,8F) for WT PU. e Percentage of freezing, representing fear response in individual mice as in a, measured before shock (baseline) and 24 hours later (contextual memory). Higher percentages of freezing indicate stronger associative memory of the aversive stimulus. Graph, mean ± s.e.m., one-way ANOVA with Bonferroni’s post-hoc, n = 17 (8M,9F) for APP V; n = 19 (10M,9F) for APP PU; n = 14 (8M,6F) for WT V; and n = 12 (6M,6F) for WT PU. See also Supplementary Fig. 10. Source data are provided as Source Data file.
Figure 10.
Figure 10.. PU-AD treatment restores synaptic plasticity and memory deficits in APP NL-F mice.
a Schematic of the experimental design for APP NL-F (APP) and WT littermates treated with vehicle (V) or PU-AD (PU) as indicated. Treatment started at an age where the mice already exhibit memory deficits (7 months of age), and continued for 3 months, until an age when the mice display severe impairments (10 months of age). OLT, object location task; RAWM, radial arm water maze; FC, fear conditioning; OF, open field; STA, sensory threshold assessment; LTP, long-term potentiation. b LTP measured as fEPSP slope (% baseline) over time in hippocampal slices from individual mice as in a. Graph, mean ± s.e.m., two-way repeated measures (RM) ANOVA. n = 16 (4M,5F) for APP V; n = 16 (4M,3F) for APP PU; n = 16 (5M,4F) for WT V; and n = 15 (4M,4F) for WT PU. c OLT data for mice as in a with short-term spatial memory determined at 1 h between the learning and the test trial, and long-term spatial memory with 24 h separation between the two trials. Mean ± s.e.m., one-way ANOVA with Bonferroni’s post-hoc, n = 16 (9M,7F) for APP V; n = 15 (7M,6F) for APP PU; n = 16 (7M,9F) for WT V; n = 14 (7M,7F) for WT PU. d RAWM performance: mean ± s.e.m. errors over sessions, analyzed via two-way RM ANOVA across all groups for day 2 and one-way ANOVA for block 10 with Bonferroni’s post-hoc, n = 12 (6M,6F) for APP V; n = 12 (7M,5F) for APP PU; n = 17 (8M,9F) for WT V; and n = 18 (9M,9F) for WT PU. e Percentage of freezing, representing fear response in individual mice, measured before shock (baseline) and 24 h later (contextual memory). Mean ± s.e.m., one-way ANOVA with Bonferroni’s post-hoc, n = 16 (9M,7F) for APP V; n = 11 (6M,5F) for APP PU; n = 18 (10M,8F) for WT V; and n = 13 (6M,7F) for WT PU. See also Supplementary Fig. 11. Source data are provided as Source Data file.

References

    1. Knopman D. S. et al. Alzheimer disease. Nat Rev Dis Primers 7, 33 (2021). - PMC - PubMed
    1. Dumas A., Destrebecq F., Esposito G., Suchonova D. & Steen Frederiksen K. Rethinking the detection and diagnosis of Alzheimer’s disease: Outcomes of a European Brain Council project. Aging Brain 4, 100093 (2023). - PMC - PubMed
    1. Sperling R. A. et al. Toward defining the preclinical stages of Alzheimer’s disease: recommendations from the National Institute on Aging-Alzheimer’s Association workgroups on diagnostic guidelines for Alzheimer’s disease. Alzheimers Dement 7, 280–292 (2011). - PMC - PubMed
    1. Aisen P. S. et al. On the path to 2025: understanding the Alzheimer’s disease continuum. Alzheimers Res. Ther. 9, 60 (2017). - PMC - PubMed
    1. Clark C., Rabl M., Dayon L. & Popp J. The promise of multi-omics approaches to discover biological alterations with clinical relevance in Alzheimer’s disease. Front. Aging Neurosci. 14, 1065904 (2022). - PMC - PubMed

Publication types

LinkOut - more resources