. 2025 Jan 13;15(6):2092-2103.
doi: 10.7150/thno.106367. eCollection 2025.

Collagen-targeted PET imaging for progressive experimental lung fibrosis quantification and monitoring of efficacy of anti-fibrotic therapies

Affiliations

Collagen-targeted PET imaging for progressive experimental lung fibrosis quantification and monitoring of efficacy of anti-fibrotic therapies

Alexandre Magno Maneschy Dias et al. Theranostics. .

Abstract

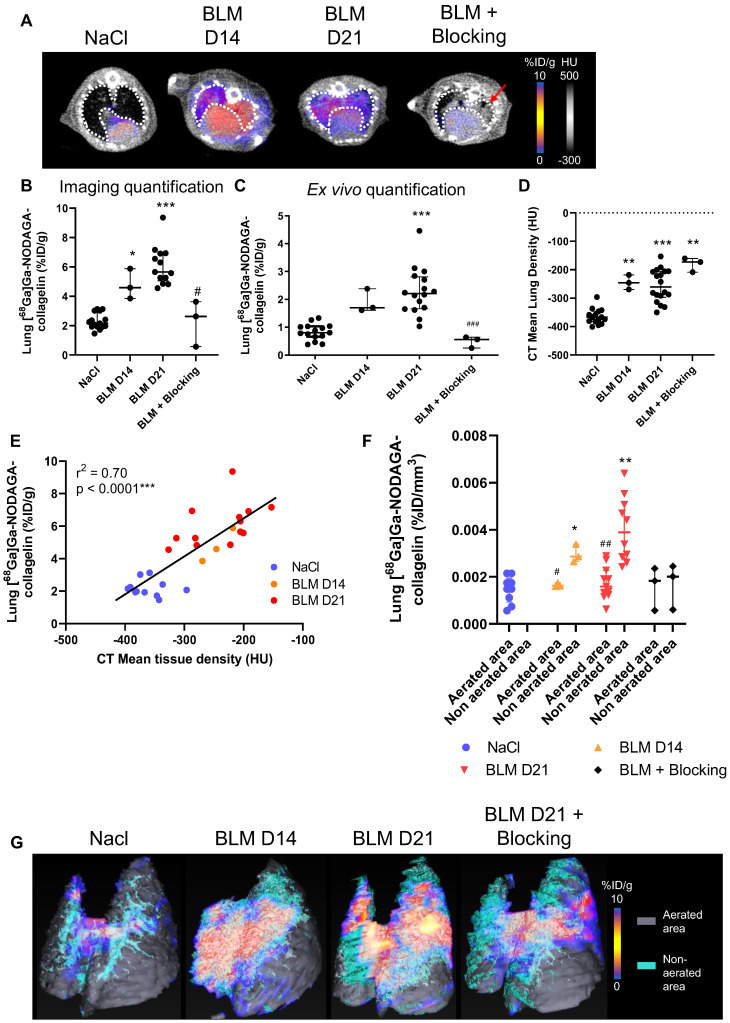
Idiopathic pulmonary fibrosis (IPF) is a progressive disease characterized by an excessive collagen deposition ultimately leading to tissue stiffening and functional decline. Beyond IPF, other progressive pulmonary fibrosis are often associated with connective tissue diseases and may develop in ∼18-32% of patients. Therapeutic options are limited to nintedanib and pirfenidone which are only able to reduce fibrosis progression without curing it. The current lack of biomarker to accurately assess and predict disease progression and therapy efficacy for IPF remains a major clinical concern. Methods: In our study, collagen deposition was monitored in bleomycin-induced lung fibrosis in mice by in vivo molecular imaging using a collagen-targeted radiopharmaceutical, [68Ga]Ga-NODAGA-collagelin. Fibrosis progression was also monitored using computed tomography, the gold standard technique to detect lung fibrosis in patients. Results: We demonstrated that the bleomycin-induced increase in collagen lung content can be accurately quantified by [68Ga]Ga-NODAGA-collagelin PET imaging in correlation with disease stage and severity. The lung uptake of [68Ga]Ga-NODAGA-collagelin was mainly found in fibrotic areas of lungs in bleomycin-receiving mice. Most interestingly, [68Ga]Ga-NODAGA-collagelin PET imaging allowed the in vivo non-invasive monitoring of nintedanib efficacy as well as the anti-fibrotic effect of the JAK inhibitor, tofacitinib. Conclusion: Thus, collagen-targeted PET imaging appears as a promising non-invasive tool for staging, monitoring and prediction of disease progression and therapy efficacy towards personalized medicine in IPF.


Conflict of interest statement

Competing Interests: The authors have declared that no competing interest exists.

Figures

Figure 1
Figure 1
[68Ga]Ga-NODAGA-collagelin is able to detect several stages of BLM-induced lung fibrosis. A/ Representative lung PET/CT images with [68Ga]Ga-NODAGA-collagelin of NaCl- and BLM-receiving mice at D14 and D21. Red arrow highlights a fibrotic area. B/ Graph represents the [68Ga]Ga-NODAGA-collagelin lung uptake in %ID/g of NaCl- and BLM-receiving mice at D14 and D21 quantified on PET images. C/ Graph represents the [68Ga]Ga-NODAGA-collagelin lung uptake in %ID/g of NaCl- and BLM-receiving mice at D14 and D21 measured by gamma counting. Results are presented as median ± interquartile range, NaCl, n = 15; BLM, D14, n = 3; BLM, D21, n = 13. D/ Graph represents the mean lung density quantified on CT images of NaCl- and BLM-receiving mice at D14 and D21. Results are presented as median ± interquartile range, NaCl, n = 15; BLM, D14, n = 3; BLM, D21, n = 13. E/ Correlation between mean lung densities (HU) measured on CT images and [68Ga]Ga-NODAGA-collagelin lung uptake (%ID/g) of corresponding lungs measured on PET/CT. F/ Graph represents the [68Ga]Ga-NODAGA-collagelin lung uptake in % ID/g of NaCl- and BLM-receiving mice at D14 and D21 in aerated and non-aerated lung areas (segmented on CT images). G/ Representative 3D rendering of the localization of [68Ga]Ga-NODAGA-collagelin uptake in the aerated (gray) and non-aerated areas (blue) of the lungs from NaCl- and BLM- receiving mice at D14 and D21. A-F/ Results are presented as median ± interquartile range, NaCl, n = 15; BLM, D14, n = 3; BLM, D21, n = 13. Stars (*) are representative of comparison of each group with NaCl group and hashs (#) are representative of statistical comparison of blocking group with BLM D21 group. Differences between groups were compared using Kruskal-Wallis non-parametric ANOVA. *(#)p < 0.05, **(##)p < 0.01, ***(###)p < 0.001.
Figure 2
Figure 2
[68Ga]Ga-NODAGA-collagelin biodistribution and autoradiography. A/ Representative Maximal Intensity Projection of PET images of [68Ga]Ga-NODAGA-collagelin in NaCl- and BLM-receiving mice at D14 and D21. B/ Global biodistribution of [68Ga]Ga-NODAGA-collagelin in NaCl- and BLM-receiving mice at D14 and D21 (and blocking group). Results are presented as median ± interquartile range, NaCl, n = 12; BLM, D14, n = 3; BLM, D21, n = 12, blocking, n = 3. C/ Elimination of 68Ga]Ga-NODAGA-collagelin in NaCl- and BLM-receiving mice at D21 (and blocking group). Results are presented as median ± interquartile range, NaCl, n = 6, BLM, D21, n = 6, blocking, n = 3. B and C/ * indicates statistic comparison with NaCl group; #, statistical comparison between BLM D21 and BLM D21 + blocking groups. Kruskal-Wallis non-parametric ANOVA. *(#)p < 0.05. D/ 68Ga-collagelin autoradiography images, picosirius red (PSR) staining, and quantification on lung sections from mice receiving NaCl or BLM (D21). Results are presented as median ± interquartile range, n = 5 for all groups, scale bar = 1 mm. *, indicates statistical comparison of each group with the NaCl group; #, statistical comparison of the blocking group with the BLM group. Kruskal-Wallis non-parametric ANOVA. ***(###)p < 0.001. E/ 68Ga-collagelin autoradiography images and collagen immunofluorescence (Green = Collagen, blue = DAPI) on lung sections from IPF patients and controls, scale bar = 200 µm.
Figure 3
Figure 3
Nintedanib reduces lung fibrosis and [68Ga]Ga-NODAGA-collagelin lung uptake. A/ Representative [68Ga]Ga-NODAGA-collagelin PET/CT images of NaCl- and BLM-receiving mice treated or not with nintedanib at D0, D8, D15 and D22. B/ Graph represents evolution of [68Ga]Ga-NODAGA-collagelin lung uptake (% ID/g) at all time points. Results are presented as median ± interquartile range, n = 4 for all groups. Black arrow represents the start of treatments. C/ Graph represents evolution of mean lung density (HU) at all time points. Results are presented as median ± interquartile range, n = 4 for all groups. Stars (*) are representative of statistical comparison between time points for each group and hashs (#) are representative of statistical comparison between the groups at each time point. Differences between groups were compared using Kruskal-Wallis non-parametric ANOVA. *(#)p < 0.05. Black arrow represents the start of treatments. D/ Graph represents the intensity of picrosirius red staining on lung section from of NaCl- and BLM-receiving mice treated or not with nintedanib at D22. Results are presented as median ± interquartile range, n = 4 for all groups. E-F/ Representative Masson trichrome (E) and PSR (F) stainings of lung sections from NaCl- and BLM-receiving mice treated or not with nintedanib (D22), scale bar = 200µm. A-D/ Results are presented as median ± interquartile range, n = 4 for all groups (B, C and D). Stars (*) are representative of comparison either between time points for each group (B, C) or with NaCl group (D). Hashs (#) are representative of statistical comparison either between groups at each time points (B, C) or with BLM and BLM + nintedanib groups (D). Differences between groups were compared using Kruskal-Wallis non-parametric ANOVA. *(#)p < 0.05, **(##)p < 0.01.
Figure 4
Figure 4
Tofacitinib reduces lung fibrosis and [68Ga]Ga-NODAGA-collagelin lung uptake. A/ Representative [68Ga]Ga-NODAGA-collagelin PET/CT images of NaCl- and BLM-receiving mice treated or not with tofacitinib at D0, D8, D15 and D22. B/ Graph represents evolution of [68Ga]Ga-NODAGA-collagelin lung uptake (%ID/g) at all time points. Black arrow represents the start of the treatment. C/ Graph represents evolution of mean lung density (HU) at all time points. Black arrow represents the start of the treatment. D/ Graph represents the intensity of picrosirius red staining on lung section from of NaCl- and BLM-receiving mice treated or not with tofacitinib at D22. E-F/ Representative Masson trichrome (E) and PSR (F) stainings of lung sections from NaCl- and BLM-receiving mice treated or not with tofacitinib (D22), scale bar = 200µm. A-D/ Results are presented as median ± interquartile range, n=4 for all. Stars (*) are representative of comparison either between time points for each group (B, C) or with NaCl group (D). Hashs (#) are representative of statistical comparison either between groups at each time points (B, C) or with BLM and BLM + tofacitinib groups (D). Differences between groups were compared using Kruskal-Wallis non-parametric ANOVA. *(#)p < 0.05, **(##)p < 0.01.
Figure 5
Figure 5
Predictive value of [68Ga]Ga-NODAGA-collagelin PET imaging for lung fibrosis progression and efficacy of nintedanib and tofacitinib. A/ Variation of [68Ga]Ga-NODAGA-collagelin lung uptake between D8 and D22 (Δ68Ga-collD8-D22) in mice receiving NaCl, BLM or BLM + nintedanib. B/ Variation of [68Ga]Ga-NODAGA-collagelin lung uptake between D8 and D22 (Δ68Ga-collD8-D22) in mice receiving NaCl, BLM or BLM + tofacitinib. C/ Correlation between variation of mean lung density between D8 and D22 (ΔCTD8-D22) and early [68Ga]Ga-NODAGA-collagelin lung uptake (D8) in BLM receiving mice. D/ Correlation between variation of mean lung density between D8 and D22 (ΔCTD8-D22) and early [68Ga]Ga-NODAGA-collagelin lung uptake (D8) in BLM receiving mice treated with nintedanib. E/ Correlation between variation of mean lung density between D8 and D22 (ΔCTD8-D22) and early [68Ga]Ga-NODAGA-collagelin lung uptake (D8) in BLM receiving mice treated with tofacitinib. A-C/ Results are presented as median ± interquartile range, n = 4 for all groups. Stars (*) are representative of comparison of each group with NaCl group and hashs (#) are representative of statistical comparison of BLM and BLM + ninedanib groups. Differences between groups were compared using Kruskal-Wallis non-parametric ANOVA. Differences between groups were compared using Kruskal-Wallis non-parametric ANOVA. *(#)p < 0.05, **(##)p < 0.01.

References

    1. Wijsenbeek M, Cottin V. Spectrum of Fibrotic Lung Diseases. N Engl J Med. 2020;383:958–68. - PubMed
    1. Raghu G, Remy-Jardin M, Myers JL, Richeldi L, Ryerson CJ, Lederer DJ. et al. Diagnosis of Idiopathic Pulmonary Fibrosis. An Official ATS/ERS/JRS/ALAT Clinical Practice Guideline. Am J Respir Crit Care Med. 2018;198:e44–e68. - PubMed
    1. Gupta R, Morgan AD, George PM, Quint JK. Incidence, prevalence and mortality of idiopathic pulmonary fibrosis in England from 2008 to 2018: a cohort study. Thorax. 2024;79:624–31. - PubMed
    1. Raghu G, Rochwerg B, Zhang Y, Garcia CA, Azuma A, Behr J. et al. An Official ATS/ERS/JRS/ALAT Clinical Practice Guideline: Treatment of Idiopathic Pulmonary Fibrosis. An Update of the 2011 Clinical Practice Guideline. Am J Respir Crit Care Med. 2015;192:e3–19. - PubMed
    1. Isser S, Maurer A, Reischl G, Schaller M, Gonzalez-Menendez I, Quintanilla-Martinez L. et al. Radiolabeled GPVI-Fc for PET Imaging of Multiple Extracellular Matrix Fibers: A New Look into Pulmonary Fibrosis Progression. J Nucl Med. 2023;64:940–5. - PMC - PubMed

MeSH terms