[Preprint]. 2025 Oct 30:2025.02.11.637750.
doi: 10.1101/2025.02.11.637750.

Mutational scanning of TnpB reveals latent activity for genome editing

Affiliations

Mutational scanning of TnpB reveals latent activity for genome editing

Brittney W Thornton et al. bioRxiv. .

Abstract

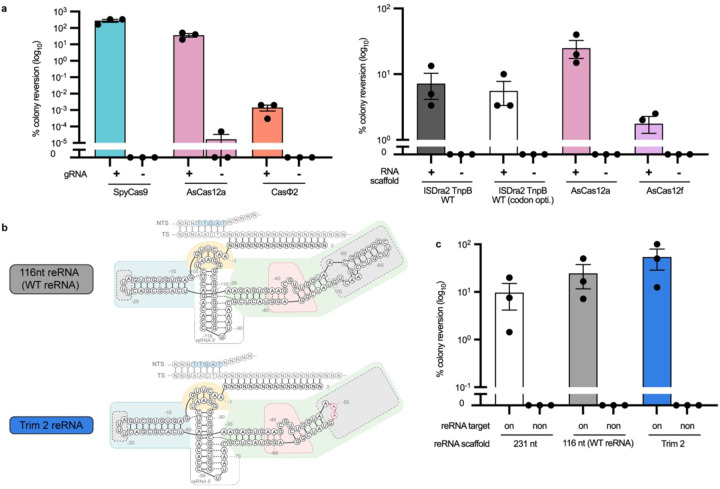
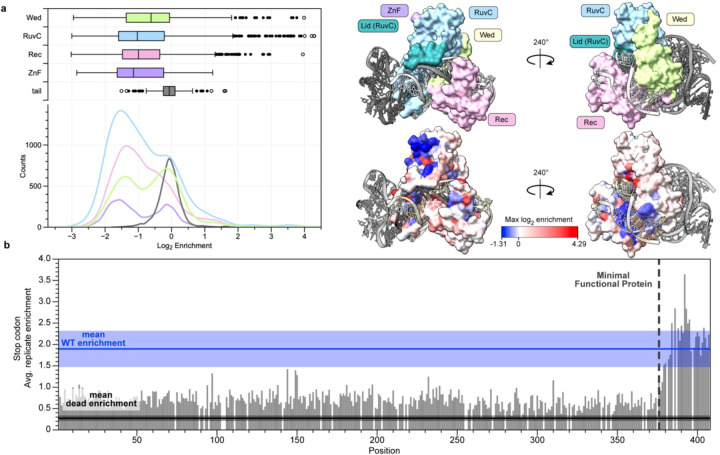
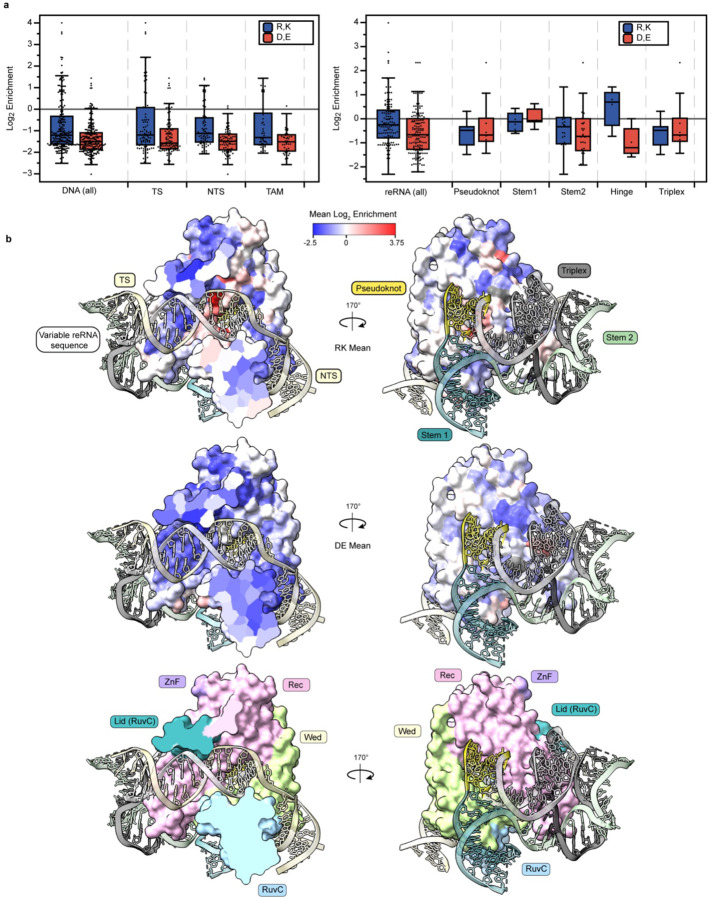
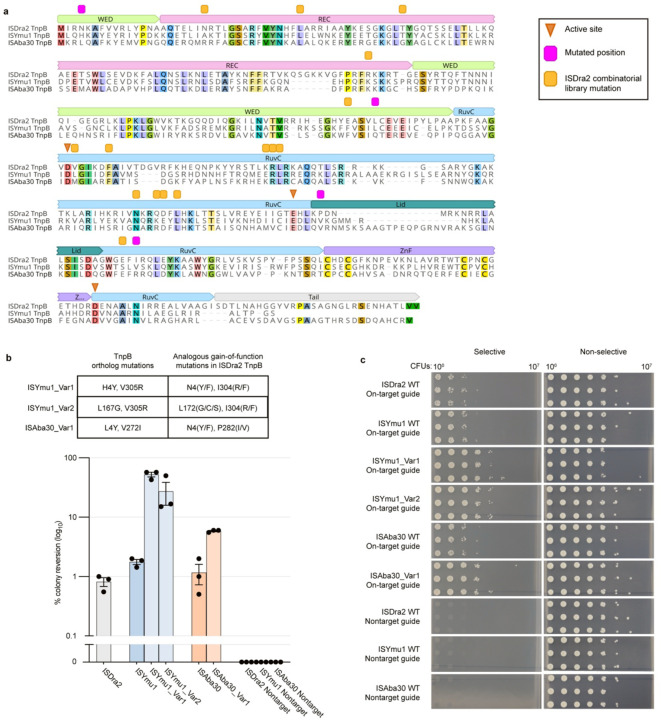
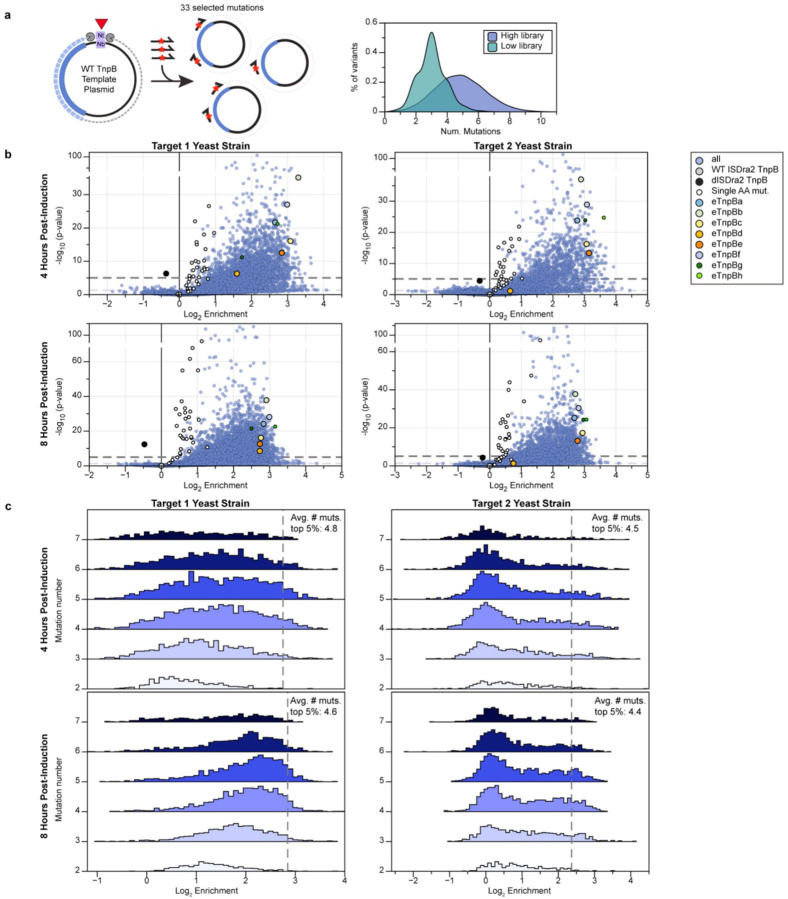
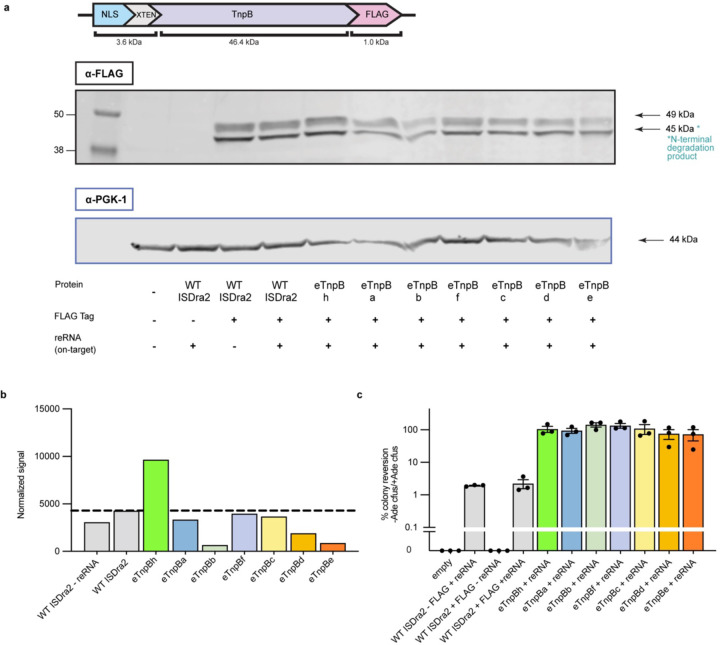
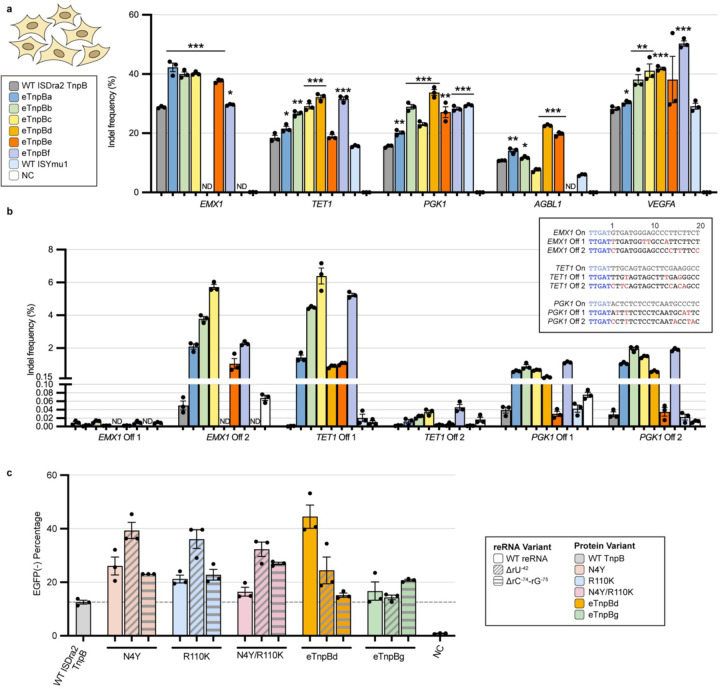
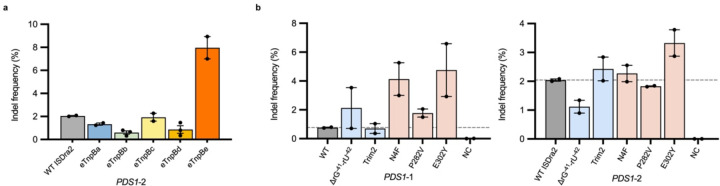
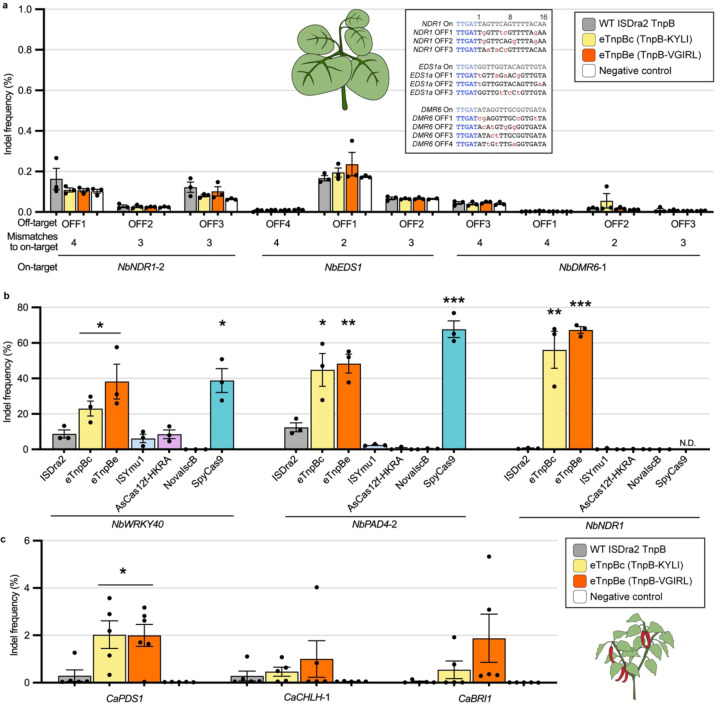
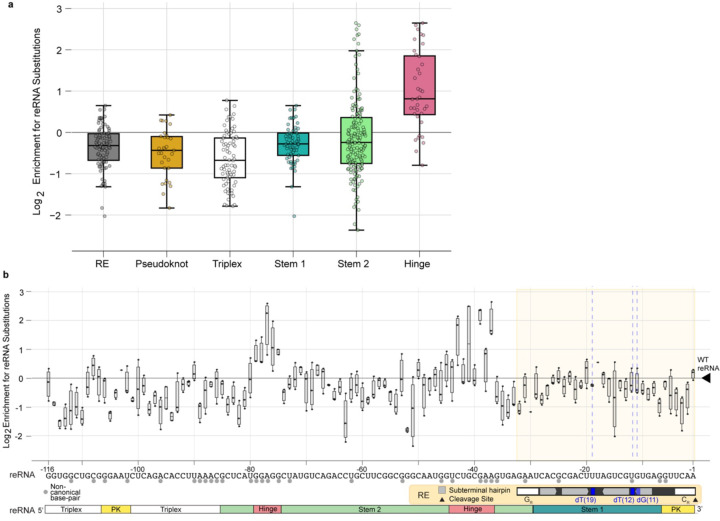
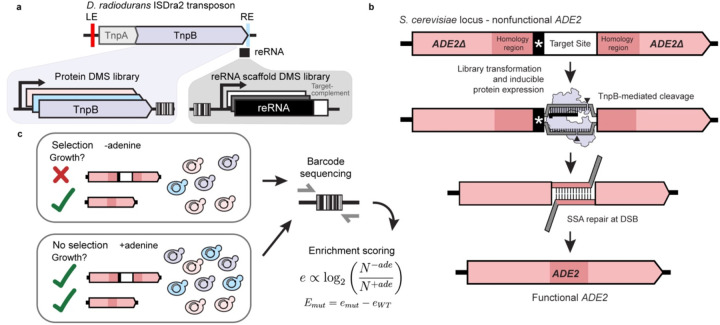
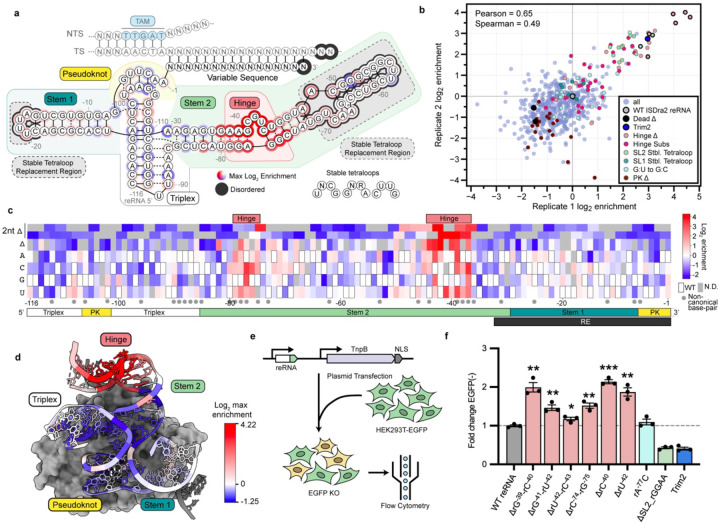
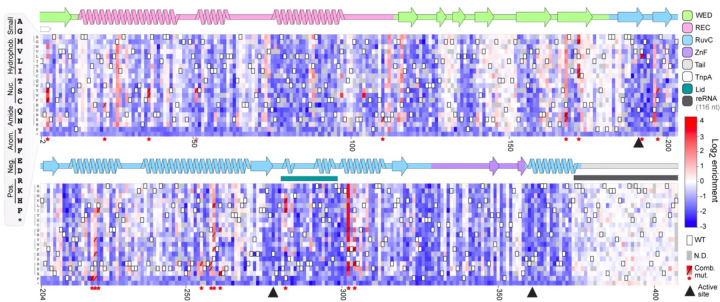
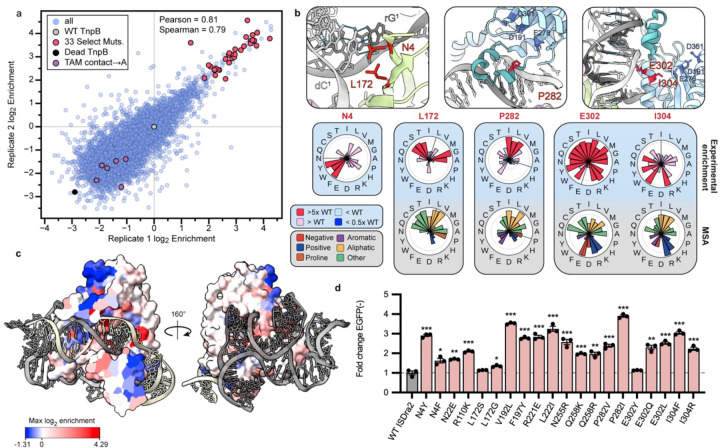
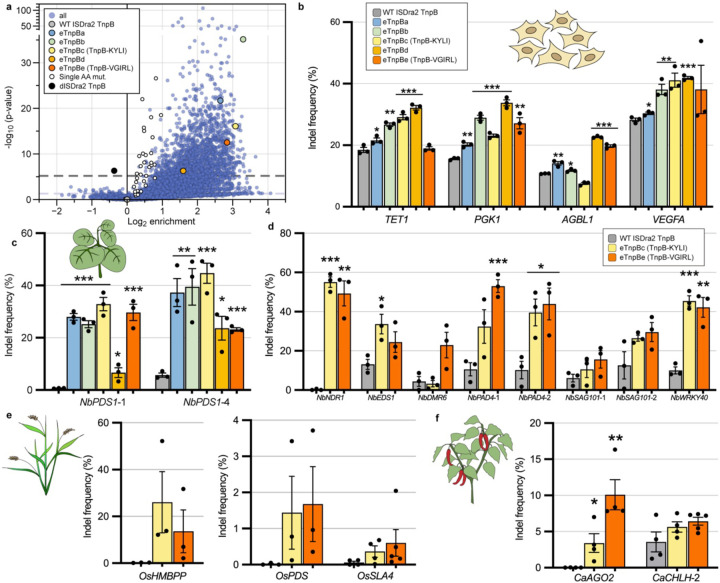
TnpB is a diverse family of RNA-guided endonucleases associated with prokaryotic transposons. Due to their small size and putative evolutionary relationship to CRISPR-Cas12, TnpB enzymes hold significant potential for genome editing. However, most TnpBs lack robust gene editing activity, and unbiased profiling of mutational effects on editing activity has not been explored. Here, we mapped comprehensive sequence-function landscapes of a TnpB ribonucleoprotein and discovered many activating mutations in both the protein and RNA. One- and two-position RNA mutants outperform existing variants, highlighting the utility of systematic RNA scaffold mutagenesis. Leveraging the protein's mutational landscape, we identified enhanced TnpB variants from a combinatorial library of activating mutations. These variants enhanced editing in human cells, N. benthamiana, pepper, and rice, with up to a fifty-fold increase compared to wild-type TnpB. These findings highlight previously unknown elements critical for regulating TnpB endonuclease activity and reveal surprising latent activity accessible through mutation.


Figures

Extended Data Figure 1.
Extended Data Figure 1.. In vivo yeast cleavage assay captures a range of RNA-guided endonuclease activity across TnpB, Cas9, and Cas12 endonucleases.
a, Assessment of Cas9, Cas12, and ISDra2 TnpB RNA-guided endonuclease activity in yeast cleavage assays, with (+) or without (−) the gRNA or reRNA. ISDra2 TnpB protein was expressed from either the non-codon-optimized open reading frame from D. radiodurans R1 (GenBank AE000513.1), or TnpB was codon optimized for high frequency codon usage between H. sapiens and S. cerevisiae. Data are plotted as the mean and s.e.m. (standard error of mean) from technical triplicate titer plating measurements (n=3). b, Schematic representation of the ISDra2 Trim2 reRNA variant (red rArA bases replacing ΔrC−50-rU−69). Color scheme corresponds to Fig. 2a. c, ISDra2 TnpB endonuclease activity in yeast with various reRNA scaffold lengths, including 231 nts, 116 nts, and the reported Trim2 reRNA variant. TnpB and reRNA were expressed in a yeast strain with an reRNA-complementary target site (on), or in a yeast strain with a non-complementary target site (non). Data are plotted as the mean and s.e.m. from technical triplicate titer plating measurements (n=3).
Extended Data Figure 2.
Extended Data Figure 2.. Distribution of enriched amino acid substitutions varies by TnpB domain
a, (Left) Histogram and box plots of the enrichment values for all protein DMS library mutations, separated by ISDra2 TnpB domain. (Right) ISDra2 domains (top right) and max enrichment per amino acid residue (bottom right) mapped onto the surface of ISDra2 TnpB ternary structure (PDB ID: 8EXA). Data are plotted as median+IQR. Outliers (Q1–1.5 IQR or Q3+1.5 IQR) drawn as circles and extreme outliers (Q1–3 IQR or Q3+3 IQR) are drawn as open circles b, Enrichment scores averaged for all stop codon mutations plotted across the length of the protein. Enrichment scores are not normalized to WT. The dashed line indicates position 376, marking the C-terminus of the minimal active TnpB truncation variant (Δ376–408) previously identified.
Extended Data Figure 3.
Extended Data Figure 3.. Positively charged amino acids are enriched near nucleic acid contacts
a, Enrichment of positively (R, K) and negatively (D, E) charged amino acid substitutions for residues proximal to nucleic acid. To assess the impact of amino acid substitutions near nucleic acids, we defined proximal residues as those with Cα atoms within 8Å from nucleic acid atoms. This cutoff ensured inclusion of previously identified direct interactions and potential contacts by R/K/D/E mutations. Data are plotted as median + IQR. b, The average enrichment for substitutions to positively charged (R, K) or negatively charged (D, E) amino acids was calculated at each position. If the WT residue was already R/K/D/E, its enrichment value was included in the average as zero. Enrichment values were mapped onto the ISDra2 TnpB cryo-EM ternary structure, with additional surface coloring by domain to help orient the reader to the structural context.
Extended Data Figure 4.
Extended Data Figure 4.. Activating mutations found for ISDra2 TnpB are transferable to TnpB orthologs.
a, Multiple structural alignment of ISDra2, ISYmu1, and ISAba30 TnpB. b-c, Activity of ortholog mutants was assessed by percent colony reversion with the yeast cleavage and compared to WT orthologs and negative non-complementary reRNA-target controls. b, Data represent mean ± s.e.m. (n = 3 technical plating replicates 8 hours post-induction). c, Titer plates (b) where each of the protein variants have been expressed in S. cerevisiae for 8 hours and titer plated on selective (-adenine) and nonselective (+adenine) media. Technical pipetting replicates from titer plates are shown.
Extended Data Figure 5.
Extended Data Figure 5.. Combinatorial library construction, experimental enrichment, and distribution of mutation number.
a, Schematic of library construction using pooled nicking mutagenesis. Plasmid was digested for ssDNA template, and 33 selected amino acid mutations at 19 positions were introduced on ssDNA oligos as described in methods. Two libraries with low and high mutation frequencies were combined, with an average of 3 and 5 mutations, respectively. b, Volcano plots of variant enrichment and statistical significance in orthogonal reporter yeast strains with different target sites. Enrichments are shown from 4 hours and 8 hours post-induction. Enrichment is calculated by averaging two biological replicates. Significance was calculated from individual barcode enrichments per variant relative to wild-type (two-sided Mann-Whitney U-test). c, Enrichment score distributions separated by variant mutation number for experimental conditions in b.
Extended Data Figure 6.
Extended Data Figure 6.. Western blots showing that expression levels of enhanced TnpB variants do not increase in S. cerevisiae.
a, (Top) Construct design for expression of ISDra2 TnpB WT protein and variants with an NLS and FLAG tag in yeast. (Bottom) Western blot from yeast lysate with anti-FLAG antibody, and with an anti-PGK1 antibody as a loading control. b, Quantification of signal from Western blot for each variant c, Activity of each variant was assessed by colony reversion in the yeast cleavage assay. Data represent mean ± s.e.m. (n = 3 technical plating replicates).
Extended Data Figure 7.
Extended Data Figure 7.. Assessment of combinatorial TnpB variant off and on-target editing, with reRNA mutants in HEK293Ts.
a, Indel frequency of six combinatorial variants at genomic loci in HEK293T cells, with WT ISDra2 TnpB, WT ISYmu1 TnpB, and no plasmid (NC) controls. Indel frequencies for eTnpBa-eTnpBe and WT TnpB at TET1, PGK1, AGBL1, and VEGFA are also represented in Fig. 5b. Data are plotted as the mean and s.e.m. from biological replicates (n=3). ND indicates no data. Stars indicate a statistically significant increase in indel frequencies compared to WT ISDra2 TnpB as calculated using a two-sided unpaired Student’s t-test. (Significance: *, **, *** for p ≤ 0.05, 0.01, 0.001, respectively). b, Indel frequency of WT and combinatorial variant TnpBs at off-target sites identified by Cas-OFFinder, with 4–6 mismatches to three on-target sites. Sample order and color scheme match a. Off-target sequences (non-target strand) are listed, with TAM in blue and reRNA-target mismatches in red. Data are plotted as the mean and s.e.m. from biological replicates (n=3). c, Pairs of reRNA deletion and ISDra2 TnpB protein mutants were tested with the EGFP KO assay, where EGFP-negative cells were measured by flow cytometry seven days after transfection. Data are presented as the mean ± s.e.m. from biological replicates (n = 3).
Extended Data Figure 8.
Extended Data Figure 8.. TnpB protein and reRNA mutants enable increases in TnpB-mediated indel frequencies in N. benthamiana.
a, Indel frequencies of TnpB combinatorial protein mutants at PDS1-2 in N. benthamiana. b, Indel frequencies of TnpB reRNA and protein mutants at PDS1-1 and PDS1-2 sites in N. benthamiana. Data represent mean ± s.e.m. (n≥2 independent agroinfiltrations). NC indicates negative control.
Extended Data Figure 9.
Extended Data Figure 9.. eTnpBc and eTnpbe are specific, highly active RNA-guided endonucleases in N. benthamiana and also show activity in pepper.
a, Indel frequency of eTnpBc and eTnpBe compared to wild-type ISDra2 TnpB and a negative control (untransformed Agrobacterium infiltration) at Cas-OFFinder-predicted off-target sites in N. benthamiana. b, Indel frequencies of ISDra2 TnpB variants compared to wild-type ISYmu1TnpB, AsCas12f-HKRA, NovaIscB, and SpyCas9. c, Indel frequencies at three genomic sites in pepper. Data are plotted as the mean and s.e.m. from biological replicates (n≥3) in a-c. Stars indicate a statistically significant increase in indel frequencies compared to WT ISDra2 TnpB as calculated using a two-sided unpaired Student’s t-test. (Significance: *, **, *** for p ≤ 0.05, 0.01, 0.001, respectively) in b-c.
Extended Data Figure 10.
Extended Data Figure 10.. Deep mutational scanning of reRNA reveals mutational tolerance within the reRNA stem 1-RE overlap
a, Box and whisker plots showing the distribution of log2 enrichment for single nucleotide substitutions around the median, normalized to the wild-type reRNA log2 enrichment. Nucleotide substitutions were grouped by reRNA region. Data are represented as the median ± IQR. b, Log2 enrichment of single-nucleotide substitutions at each position in the reRNA, presented as a box- and-whisker plot, with each point representing an individual mutant. The x-axis includes annotations for both the overlapping RE DNA and reRNA sequences. Within the RE, key functional elements are highlighted, including the ssDNA subterminal hairpins recognized by TnpA for transposon excision, as well as the tetranucleotide cleavage (CR) and guide (GR) sequences, which form base-pair interactions and direct TnpA cleavage,. Additionally, positions within the subterminal hairpin important for TnpA binding and strand discrimination are indicated in blue.
Figure 1.
Figure 1.. Design of deep mutational scanning libraries and optimized in vivo selection for endonuclease activity in yeast.
a, TnpB protein and reRNA from the D. radiodurans ISDra2 transposon were placed under the control of separate regulatory elements. Deep mutational scanning libraries were constructed for both molecules and assayed separately. b, Schematic of the yeast-based cleavage assay used for individual variant testing and high-throughput library experiments. On-target double-stranded breaks in the reporter cassette enable repair of the ADE2 locus by single-stranded annealing at duplicate homology regions. ADE2 repair rescues colony growth in selective, adenine-deficient media. c, Representation of the library selection. Plasmid DNA from yeast grown in selective (-adenine) and non-selective (+adenine) conditions was extracted. Barcodes from plasmids were sequenced and the log-ratio of barcode abundance in selective over nonselective conditions was used to assess variant enrichment. Enrichment of variants was normalized to the wild-type TnpB RNP enrichment.
Figure 2.
Figure 2.. Profiling the TnpB reRNA mutational landscape reveals single nucleotide gain-of-function mutations.
a, Schematic of the ISDra2 reRNA based on the RNP cryo-EM structure, adapted from Sasnauskas et al. 2023. Dashed boxes indicate truncations replaced with stable tetraloops. Circles around bases are colored by maximum log2 enrichment scores for a substitution at each position, using the same color scale as in c. Outer gray-circled bases indicate regions not modeled in the ternary structure, labeled here as disordered. b, Log2 enrichment of reRNA variants across two experimental replicates. Data is normalized such that WT TnpB is at 0. c, Heatmap of enrichment scores for reRNA variants with single-nucleotide substitutions or single- and double-nucleotide deletions. WT positions are colored in white, and gray boxes denote no available data. d, Structure of TnpB ternary complex (PDB ID: 8EXA), with reRNA colored by positional maximum log2 enrichment scores e, Experimental workflow of EGFP knockout assay in HEK293T EGFP+ cells. EGFP cells were assessed by flow cytometry to compare editing activities of TnpB variants, as described in Methods. f, EGFP KO assay in HEK293T EGFP+ cells for highly enriched reRNA mutants identified with bold black outlines in b. Colors match the legend in b. Fold change of EGFP percent population for each variant compared to WT TnpB is shown. Data are presented as the mean ± s.e.m. (standard error of mean) from biological replicates (n = 3). Stars indicate a statistically significant increase in indel frequencies compared to WT ISDra2 reRNA as calculated using a two-sided unpaired Student’s t-test. (Significance: *, **, *** for p ≤ 0.05, 0.01, 0.001, respectively).
Figure 3.
Figure 3.. Deep mutational scanning of the TnpB protein identifies mutations that increase activity.
Heatmap showing log2 enrichment scores of all single amino acid changes. TnpB secondary structures and domains are annotated above the heatmap. Outlined white boxes represent wild-type residues. Gray boxes denote positions with no available data. Boxes with a slash and a star at the x-axis represent a mutation that was included in the combinatorial variant library. Black triangles represent active site catalytic residues.
Figure 4.
Figure 4.. Activating mutations inform mechanistic insights and engineering.
a, Log2 enrichment of single amino acid variants across two experimental replicates. Data is normalized such that WT TnpB is at zero. Thirty-three mutations were selected from the combinatorial library. Purple points correspond to alanine mutations at the TAM-interacting residues (Y52A, K76A, Q80A, T123A, S56A, F77A, N124A) shown to abrogate or reduce TnpB activity. b, Close-up view of residues N4, P282, E302, and I304 in red in the ISDra2 TnpB ternary structure (PDB ID: 8EXA). RuvC catalytic residues are colored and labeled in dark blue. Site-wise amino acid enrichment and multiple-sequence alignment (MSA) conservation are displayed on radar plots below. N4 MSA data not shown due to low sequence conservation at the N-terminus. c, Max enrichment per residue mapped onto the surface of ISDra2 TnpB ternary structure, shown as a cross-section (left), allowing for visibility of the heteroduplex (PDB ID: 8EXA). The reRNA is shown in gray and DNA in light yellow. d, Activity of the highly enriched single amino acid mutants was assessed with the EGFP KO assay in HEK293T EGFP+ cells. Fold change of EGFP cells (percent of population) for each variant relative to WT TnpB is shown. Data are presented as the mean ± s.e.m. from biological replicates (n = 3). Stars indicate a statistically significant increase in indel frequencies compared to WT ISDra2 TnpB as calculated using a two-sided unpaired Student’s t-test. (Significance: *, **, *** for p ≤ 0.05, 0.01, 0.001, respectively).
Figure 5.
Figure 5.. Enhanced TnpB variants engineered by combining high-activity mutations.
a, Volcano plot depicting combinatorial variant average enrichment and statistical significance, after selection in a reporter yeast strain. Individual barcodes were used to calculate significance with a two-sided Mann-Whitney U-test. b, Indel frequency of five combinatorial variants at four genomic loci in HEK293T cells. Plasmids carrying TnpB variants were delivered via transfection, and genomic DNA was sequenced as described in methods. c, Indel frequency of TnpB variants targeting two sites in PDS1 in N. benthamiana. Legend, same as in b. d, Indel frequency of WT ISDra2, TnpB-KYLI, and TnpB-VGIRL targeting eight sites in N. benthamiana. e, Indel frequencies of ISDra2 TnpB variants targeting three sites in rice callus tissue. f, Indel frequency of TnpB variants targeting two sites in pepper. TnpB variants were delivered by agroinfiltration, and indel frequencies were quantified from harvested tissue as described in the methods for c-f. Data are plotted as the mean and s.e.m. from biological replicates (n≥3) in b-f. Stars indicate a statistically significant increase in indel frequencies compared to WT ISDra2 TnpB as calculated using a two-sided unpaired Student’s t-test. (Significance: *, **, *** for p ≤ 0.05, 0.01, 0.001, respectively) in b-f.

References

    1. Altae-Tran H. et al. Diversity, evolution, and classification of the RNA-guided nucleases TnpB and Cas12. Proc. Natl. Acad. Sci. U. S. A. 120, e2308224120 (2023). - PMC - PubMed
    1. Karvelis T. et al. Transposon-associated TnpB is a programmable RNA-guided DNA endonuclease. Nature 599, 692–696 (2021). - PMC - PubMed
    1. Altae-Tran H. et al. The widespread IS200/IS605 transposon family encodes diverse programmable RNA-guided endonucleases. Science 374, 57–65 (2021). - PMC - PubMed
    1. Shmakov S. et al. Diversity and evolution of class 2 CRISPR-Cas systems. Nat. Rev. Microbiol. 15, 169–182 (2017). - PMC - PubMed
    1. Makarova K. S. et al. Evolutionary classification of CRISPR-Cas systems: a burst of class 2 and derived variants. Nat. Rev. Microbiol. 18, 67–83 (2020). - PMC - PubMed

Methods References

    1. Wrenbeck E. E. et al. Plasmid-based one-pot saturation mutagenesis. Nat. Methods 13, 928–930 (2016). - PMC - PubMed
    1. Mighell T. L., Toledano I. & Lehner B. SUNi mutagenesis: Scalable and uniform nicking for efficient generation of variant libraries. PLoS One 18, e0288158 (2023). - PMC - PubMed
    1. Li H. Minimap2: pairwise alignment for nucleotide sequences. Bioinformatics 34, 3094–3100 (2018). - PMC - PubMed
    1. Li H. et al. The Sequence Alignment/Map format and SAMtools. Bioinformatics 25, 2078–2079 (2009). - PMC - PubMed
    1. Stuckey S. & Storici F. Gene knockouts, in vivo site-directed mutagenesis and other modifications using the delitto perfetto system in Saccharomyces cerevisiae. Methods Enzymol. 533, 103–131 (2013). - PubMed

Publication types

LinkOut - more resources