[Preprint]. 2025 Feb 16:2025.02.15.638448.
doi: 10.1101/2025.02.15.638448.

Optical Pooled Screening for the Discovery of Regulators of the Alternative Lengthening of Telomeres Pathway

Affiliations

Optical Pooled Screening for the Discovery of Regulators of the Alternative Lengthening of Telomeres Pathway

Isabel Quintanilla et al. bioRxiv. .

Update in

Abstract

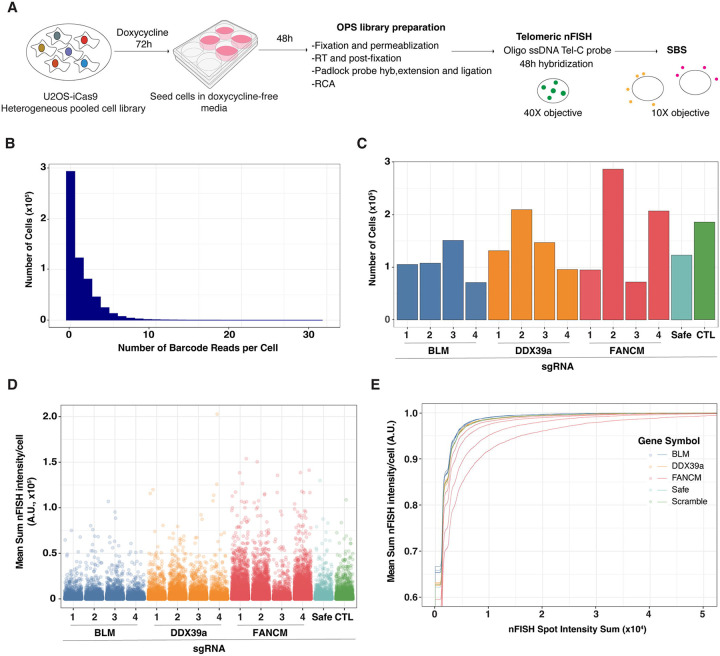
Telomere elongation is essential for the proliferation of cancer cells. Telomere length control is achieved by either the activation of the telomerase enzyme or the recombination-based Alternative Lengthening of Telomeres (ALT) pathway. ALT is active in about 10-15% of human cancers, but its molecular underpinnings remain poorly understood, preventing the discovery of potential novel therapeutic targets. Pooled CRISPR-based functional genomic screens enable the unbiased discovery of molecular factors involved in cancer biology. Recently, Optical Pooled Screens (OPS) have significantly extended the capabilities of pooled functional genomics screens to enable sensitive imaging-based readouts at the single cell level and large scale. To gain a better understanding of the ALT pathway, we developed a novel OPS assay that employs telomeric native DNA FISH (nFISH) as an optical quantitative readout to measure ALT activity. The assay uses standard OPS protocols for library preparation and sequencing. As a critical element, an optimized nFISH protocol is performed before in situ sequencing to maximize the assay performance. We show that the modified nFISH protocol faithfully detects changes in ALT activity upon CRISPR knock-out (KO) of the FANCM and BLM genes which were previously implicated in ALT. Overall, the OPS-nFISH assay is a reliable method that can provide deep insights into the ALT pathway in a high-throughput format.

Keywords: Alternative Lengthening of Telomeres; CRISPR/Cas9; Cancer; Functional Genomics; Optical Pooled Screen.


Figures

Figure 1.
Figure 1.. Overview of the OPS workflow and its implementation
A) OPS experimental workflow. A lentiviral library containing sgRNAs of interest was transduced into target spCas9-expressing cells at a low multiplicity of infection (MOI), followed by selection for a resistance marker to generate a heterogenous pooled cell library. Cells with an integrated lentiviral vector were then fixed and permeabilized. Subsequently, the mRNA containing the sgRNA sequence was retrotranscribed in situ using an LNA-modified oligo. Next, a padlock probe was hybridized around the sgRNA sequence of the cDNA followed by probe extension and ligation. The circularized probe containing the sgRNA sequence was used as a template to perform rolling circle amplification (RCA) and the resulting amplification product is sequenced using sequencing-by-synthesis (SBS) chemistry, a form of in situ sequencing (ISS). B) Representative images of 3 ISS cycles using 4-color SBS chemistry. Scale bar: 20 microns. C) Boxplots showing the number of RCA spots per cell detected in three different cell lines expressing 5 sgRNAs at a time and using conventional OPS protocol. The middle line represents the 50th percentile. The edges of the box represent the 25th and 75th percentile, respectively. The whiskers extend to 1.5 * Inter Quantile Range (IQR). D) Plot showing the inverse relationship between the length of the sgRNA read and genotyping accuracy when using ISS. E) Graph illustrating the direct relationship between spot quality threshold and genotyping accuracy when using ISS. F) Bar plot showing the percentage of lamin A-positive cells when hTERT-RPE-Cas9 cells are transduced with just a control non-targeting sgRNA (sgCTL) or an equimolar mix of 3 LMNA-targeting and 2 scrambled/non-targeting sgRNAs (sgLMNA). Mean± SD. G) Example images of hTERT-RPE-Cas9-sgLMNA cells stained with an anti-lamin A primary antibody and a Alexa488-conjugated secondary antibody together with a segmentation and sgRNA classification mask. Scale bar, 20 microns. H) Density plot showing the distribution of lamin A mean intensity values across hTERT-RPE-Cas9-sgLMNA cells. The proportion of cells with lower lamin A intensity values is larger in cells expressing LMNA-targeting sgRNAs in comparison to cells expressing non-targeting sgRNAs.
Figure 2.
Figure 2.. Optimization of the OPS-nFISH protocol and its integration with ISS.
A) OPS experimental workflow illustrating the steps in the ISS library preparation where the nFISH protocol can be integrated. B) Example nFISH and ISS images when both protocols are performed individually in U2OS-Cas9-sgScramble cells. ISS/RCA spot images are obtained after hybridizing a fluorescent probe against a constant region of the sgRNA-padlock probe construct previously amplified by RCA. Scale bar: 20 microns. C) Representative nFISH and ISS images when the phenotyping protocol is performed after retrotranscription (RT) and post-fixation (Option i) in U2OS-Cas9-sgScramble cells. (Top panel) nFISH images when a PNA-TelG probe is used. (Middle panel) nFISH images when RT primer is removed from reaction. (Bottom panel) ISS images showing the lack of RCA spots when ISS and nFISH are combined using Option i. Scale bar: 20 microns. D) Representative nFISH and ISS images when the phenotyping protocol is performed after RCA reaction (Option ii) and using different telomeric probes in U2OS-Cas9 cells transduced with sgCTL. (Top panel) nFISH images when the PNA-TelG probe is used. (Middle panels) nFISH images when oligo ssDNA TelG or oligo ssDNA TelC are used. (Bottom panel) Example RCA spot images regardless of telomeric probe used for nFISH. Scale bar: 20 microns. E) Bar plot of the difference in mean RCA spots per cell between ISS protocol performed individually or in combination with nFISH using Option ii. Mean± SD. F) Plot showing the difference in telomeric integrated fluorescence intensity between 24 h and 48 h of oligo ssDNA TelC probe hybridization. Mean± SD. G) Bar plot illustrating how increasing the oligo ssDNA TelC probe concentration results in a steady increase in telomeric integrated fluorescence intensity. Mean± SD. H) Example nFISH images showing the increase in telomeric signal after U2OS-Cas9-sgScamble cells are treated with 10 mM of a TLK inhibitor (TLKi) for 6 h. Scale bar: 20 microns. I) Quantification of telomeric integrated fluorescence intensity for non-treated and TLKi-treated U2OS-Cas9-sgScramble cells. Mean± SD.
Figure 3.
Figure 3.. Validation of CRISPR efficiency and telomeric nFISH signal detection in U2OS-iCas9 cells.
A) Quantification of the telomeric integrated fluorescence intensity for U2OS-Cas9 cells transduced with either lentiviral sgCTL alone or with an equimolar mix of 4 lentiviral FANCM-targeting and 2 different scrambled/non-targeting sgRNAs (sgFANCM). Mean± SD. B) Illustration of the lentiviral vector used to evaluate CRISPR efficiency, pXPR-011[29]. This vector expresses the gene EGFP and an EGFP-targeting sgRNA. C) Representative images of uninduced (Dox−) and induced (Dox+) U2OS-iCas9 cells transduced with pXPR-011. Scale bar: 20 microns. D) Bar plot showing the decrease in total EGFP intensity in induced (Dox+) U2OS-iCas9-pXPR-011 cells compared to uninduced (Dox−) cells. E) Graph showing a decrease in the percentage of EGFP-positive U2OS-iCas9-pXPR-011 cells when Cas9 expression is induced with doxycycline compared to uninduced cells. Mean± SD. F) Example nFISH images of uninduced (Dox−) and induced (Dox+) U2OS-iCas9 cells transduced with sgFANCM. Scale bar: 20 microns. G) Plot illustrating the increase in telomeric integrated fluorescence intensity for induced (Dox+) U2OS-iCas9-sgFANCM cells compared to uninduced (Dox−) cells. Mean± SD.
Figure 4.
Figure 4.. OPS-nFISH experimental workflow and analysis of telomeric signal detection
A) OPS-nFISH experimental workflow. spCas9 expression was induced in the pooled cell library by treating the cells with 0.05 μg/mL doxycycline for 72h followed by seeding the cells in a 6-well plate using doxycycline-free media. After 48h, cells were fixed and processed for OPS library preparation. Then, telomeric nFISH was performed using the modified oligo ssDNA protocol, followed by SBS reactions to read the sgRNAs expressed in each cell. B) Plot showing the number of sgRNA barcode reads per cell detected during ISS in the pooled cell library. C) Bar plot showing the number of cells expressing each sgRNA in the library. D) Single-cell quantification of telomeric integrated fluorescence intensity associated to each sgRNA. E) Empirical Cumulative Distribution Function (ECDF) plot showing the cumulative distribution of telomeric integrated fluorescence intensity based on the different sgRNAs present in the library.

References

    1. Hanahan D., Weinberg R.A., Hallmarks of cancer: the next generation, Cell 144 (2011) 646–674. 10.1016/j.cell.2011.02.013. - DOI - PubMed
    1. Yuan X., Larsson C., Xu D., Mechanisms underlying the activation of TERT transcription and telomerase activity in human cancer: old actors and new players, Oncogene 38 (2019) 6172–6183. 10.1038/s41388-019-0872-9. - DOI - PMC - PubMed
    1. Dunham M.A., Neumann A.A., Fasching C.L., Reddel R.R., Telomere maintenance by recombination in human cells, Nat. Genet. 26 (2000) 447–450. 10.1038/82586. - DOI - PubMed
    1. Bryan T.M., Englezou A., Dalla-Pozza L., Dunham M.A., Reddel R.R., Evidence for an alternative mechanism for maintaining telomere length in human tumors and tumor-derived cell lines, Nat. Med. 3 (1997) 1271–1274. 10.1038/nm1197-1271. - DOI - PubMed
    1. Zhang J.-M., Zou L., Alternative lengthening of telomeres: from molecular mechanisms to therapeutic outlooks, Cell Biosci. 10 (2020) 30. 10.1186/s13578-020-00391-6. - DOI - PMC - PubMed

Publication types