[Preprint]. 2025 Feb 11:2025.02.10.637451.
doi: 10.1101/2025.02.10.637451.

Cohesin drives chromatin scanning during the RAD51-mediated homology search

Affiliations

Cohesin drives chromatin scanning during the RAD51-mediated homology search

Alberto Marin-Gonzalez et al. bioRxiv. .

Update in

Abstract

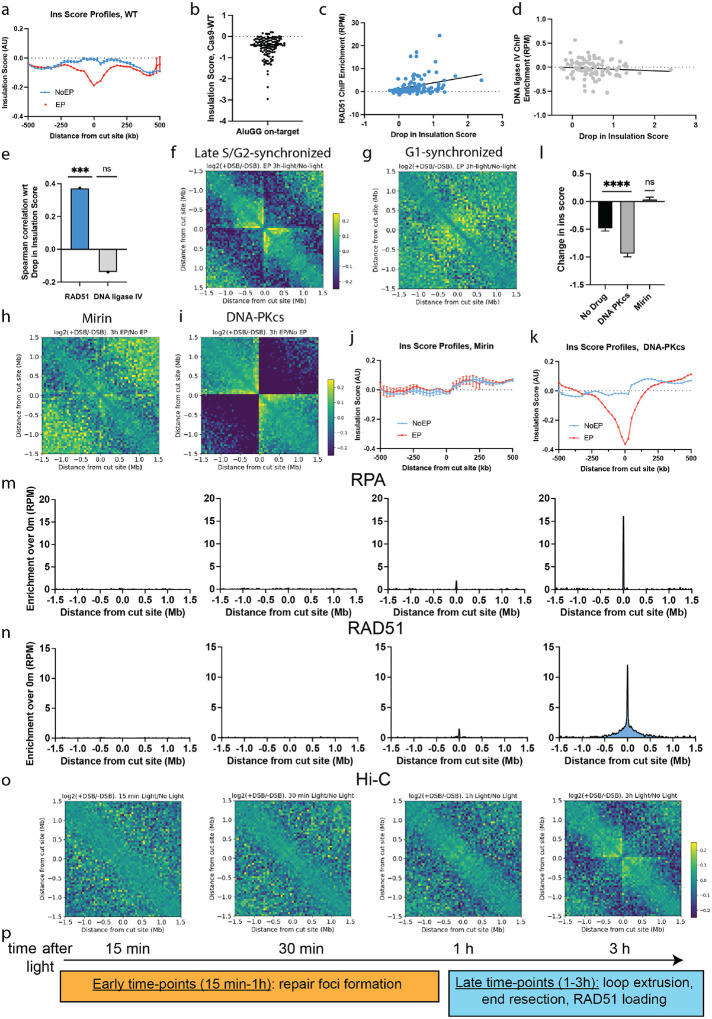
Cohesin folds genomes into chromatin loops, whose roles are under debate. We report that double strand breaks (DSB) induce de novo formation of chromatin loops, with the break positioned at the loop base. These loops form only in S/G2 phases and occur during repair via homologous recombination (HR), concomitant with DNA end resection and RAD51 assembly. RAD51 showed two-tiered accumulation around DSBs, with a broad (~Mb) domain arising from the homology search. This domain is regulated by cohesin unloader, is constrained by TAD boundaries, and it overlaps with chromatin regions reeled through the break-anchored loop, suggesting that loop extrusion regulates the homology search. Indeed, depletion of NIPBL results in reduced HR, and this effect is more pronounced when the HR donor is far (~100 kb) from the break. Our data indicates that loop-extruding cohesin promotes the mammalian homology search by facilitating break-chromatin interactions within the damaged TAD.


Conflict of interest statement

Competing interests: Authors declare that they have no competing interests.

Figures

Figure 1.
Figure 1.. Break-anchored chromatin loops at Cas9 breaks.
a, High-resolution (5 kb) Hi-C maps around two representative AluGG cut sites (in chr9, top; and chr14, bottom) in HEK293T. Untreated samples are shown in the top right triangle, Cas9-treated samples are shown in bottom left. b, Average log2 ratio of chromatin contacts around the best 100 AluGG cut sites with the strongest MRE11 enrichment. Hi-C matrices were retrieved at 50 kb resolution in a window of 3 Mb, centered at each MRE11 peak. c, 4C-like plots were computed from high-resolution Hi-C matrices around the top 100 MRE11 peaks using a left and right viewpoint with respect to the cut site for the Cas9-treated and undamaged sample. d, Cas9-induced chromatin contacts in control siRNA and RAD21 siRNA treated HEK293T cells. Differential Hi-C contacts were computed and plotted as in panel b. e, f, Cas9-induced NIPBL and RAD21 ChIP-Seq enrichment. ChIP-Seq profiles for NIPBL and RAD21 were averaged around the 126 AluGG on-target sites in Cas9-treated and untreated cells. The resulting untreated profile was subtracted from the Cas9-treated profile. g-i, Time-course γH2AX (g), 53BP1 (h) ChIP-Seq and Hi-C (i). HEK293T cells were treated with Cas9 RNP with caged AluGG gRNA for 12h, followed by light-induced Cas9 activation and harvest at 0 min, 15 min, 30 min, 1 h and 3 h. ChIP-Seq profiles were computed as described in panel e, f, and average Hi-C profile was obtained as in panel b, using the 0 min (no-light) control sample as reference. j, A proposed timeline.
Figure 2.
Figure 2.. Break-anchored chromatin loops are formed during homologous recombination.
a, Insulation score analysis around Cas9 breaks. Whole-chromosome Hi-C matrices were retrieved at 25 kb resolution and insulation score was then computed for each chromosome using the matrix2insulation script from the cworld package (29). Profiles were extracted in a window of 1 Mb around each of the 126 AluGG on-target sites and averaged. b, Change in insulation score upon Cas9 treatment was computed in a window of 50 kb centered around each AluGG on-target site. Note: reduced insulation score implies increased insulation. c, d, ChIP-Seq enrichment of RAD51 (c) and DNA ligase IV (d) vs drop in insulation score upon Cas9 treatment per cut site. Black lines are linear fits. e, Spearman correlation coefficient from (c) and (d). f, g, Averaged differential Hi-C contact maps in HEK293T cells synchronized in late S/G2 (f) or G1 (g). h, i, Averaged differential Hi-C contact maps treated with Mirin (h) or DNA-PKcs inhibitor (i). j, k, Insulation score profiles around on-target AluGG in cells treated with Mirin (j) or DNA-PKcs inhibitor (k). l, Cas9-induced change in insulation score around AluGG on-target sites in cells without drug, or treated with DNA-PKcs inhibitor or Mirin. Error bars are the standard error of the mean. Statistical significance with respect to null hypothesis was obtained using one sample t-test. m-o, Time-course RPA (m), RAD51 (n) ChIP-Seq and Hi-C (o). Hi-C plots are reproduced from Fig. 1i for each comparison. p, A proposed timeline.
Figure 3.
Figure 3.. Broad RAD51 ChIP-Seq profiles inform on homology search.
a-d, Average RPA (a, b) and RAD51 (c, d) ChIP-Seq profiles around AluGG on-target sites in a window of 30 kb (a, c) and 3 Mb (b, d). Arrows mark narrow (RPA, RAD51) and broad (RAD51) peaks. c, Average width of RPA and RAD51 peaks. Error = standard error of the mean. f, g, Strand specific ChIP-Seq of RAD51. Top panels are regular ChIP profiles (30 kb and 1 Mb windows). Bottom panels show the strand asymmetry, computed as the difference between the forward and the reverse reads. h, Cartoon depicting the interpretation of the broad RAD51 profile as a measure of homology search. i, Schematic of the HR-GFP reporter system to measure DSB-induced HR. GFP-I-SceI heteroallele harbors a site for DSB induction. HR repair via use of a 5’-Truncated GFP donor (~3 kb away from the DSB) generates WT GFP that can be measured in flow cytometry. j, Schematic of the reporter system designed to study HR using distant donors within the TAD. A monoclonal mES cell clone was generated with a single GFP-I-SceI copy at Rosa26 on Chr6. Then, derivative monoclonal lines were made with the Δ5’-GFP HR donor at +441 kb or +563 kb from the GFP-I-SceI copy. k, HR readout for the original cell line (with the donor at ~3 kb from the break), four Donor+441 clones, a Donor+563 clone, and the donor-less clone. l, RAD51 ChIP-Seq profile in donor-less cells (top), in two of the Donor+441 clones and the Donor+563 clone. m, Zoom-in of (l) showing the RAD51 signal over Δ5’-GFP in the donor-less clone vs. two Donor+441 clones. The donor-less clone ChIP-Seq data in panels m, l was aligned to a genome containing a +441kb donor.
Figure 4.
Figure 4.. Loop-extruding cohesin regulates homology search and overall HR efficiency.
a, RAD51 ChIP-Seq enrichment averaged around all TAD boundaries that lie 200 kb to 700 kb away from the 100 best Cas9 cut sites. b, RAD51 drop at TAD boundaries and random sites (picked at distances between 200 kb and 700 kb away from cut sites). Error = standard error of the mean. One-sample t-test was done to quantify significance from null hypothesis. c, RAD51 ChIP-Seq profile at ACTB gene in HEK293T. d, e, Average RAD51 ChIP-Seq profiles after Cas9-AluGG-gRNA-induced DSBs in HCT-WAPL-AID2 cells without (d) or with (e) auxin. f, g, Average change in RAD51 ChIP-Seq enrichment was obtained at regions −1.5 to 0.5 Mb (f) or 0.5 to 1.5 Mb (g) away from the cut. Error = the standard error of the mean. Unpaired t-test was done to quantify significance between the two conditions. h, HR-GFP assays were performed on the monoclonal cell lines from Fig. 3k after treatment with siRNA against luciferase (Luc), Nipbl or Rad51. i, j, Quantification of h, showing changes in HR following depletion of Nipbl- (i) or Rad51-induced (j), normalized to Luciferase siRNA HR levels. k, Cartoon depicting different mechanisms for cohesin-driven chromatin scanning during homology search.

References

    1. Dixon J. R. et al. , Topological domains in mammalian genomes identified by analysis of chromatin interactions. Nature 485, 376–380 (2012). - PMC - PubMed
    1. Rao Suhas S. P. et al. , A 3D Map of the Human Genome at Kilobase Resolution Reveals Principles of Chromatin Looping. Cell 159, 1665–1680 (2014). - PMC - PubMed
    1. Rao S. S. P. et al. , Cohesin Loss Eliminates All Loop Domains. Cell 171, 305–320.e324 (2017). - PMC - PubMed
    1. Schwarzer W. et al. , Two independent modes of chromatin organization revealed by cohesin removal. Nature 551, 51–56 (2017). - PMC - PubMed
    1. Fudenberg G. et al. , Formation of Chromosomal Domains by Loop Extrusion. Cell Reports 15, 2038–2049 (2016). - PMC - PubMed

Publication types