[Preprint]. 2025 Feb 10:2024.02.28.582546.
doi: 10.1101/2024.02.28.582546.

A Massively Parallel CRISPR-Based Screening Platform for Modifiers of Neuronal Activity

Affiliations

A Massively Parallel CRISPR-Based Screening Platform for Modifiers of Neuronal Activity

Steven C Boggess et al. bioRxiv. .

Abstract

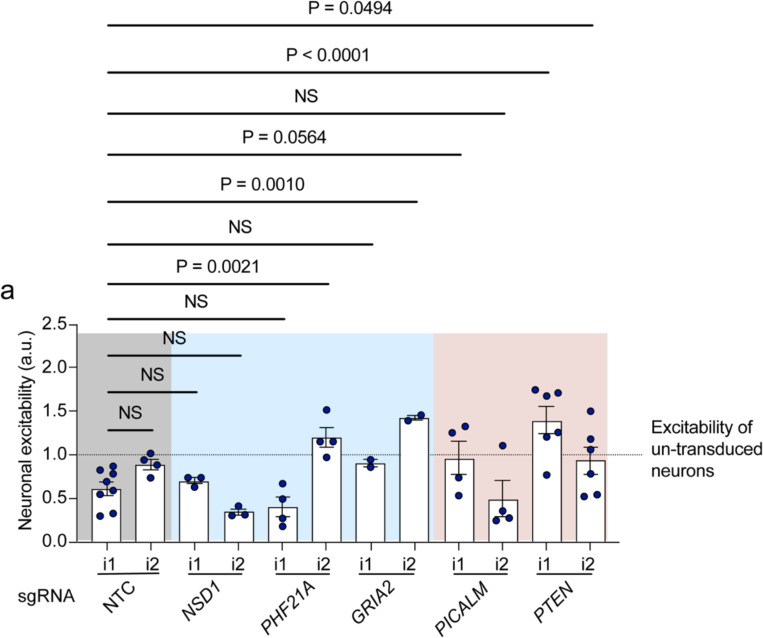
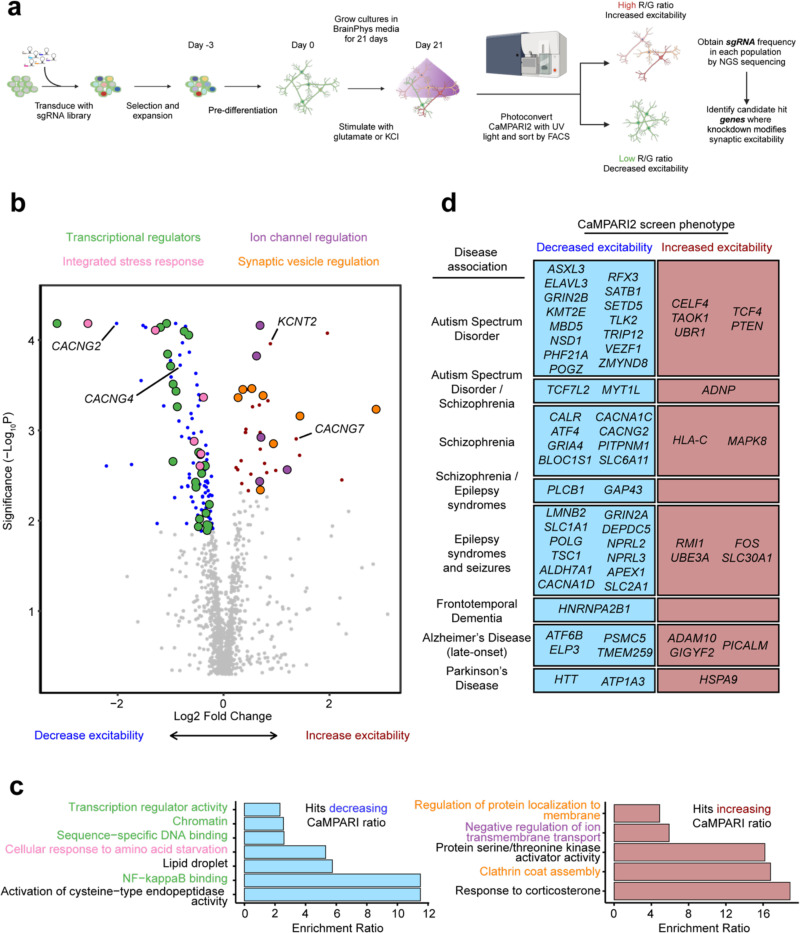
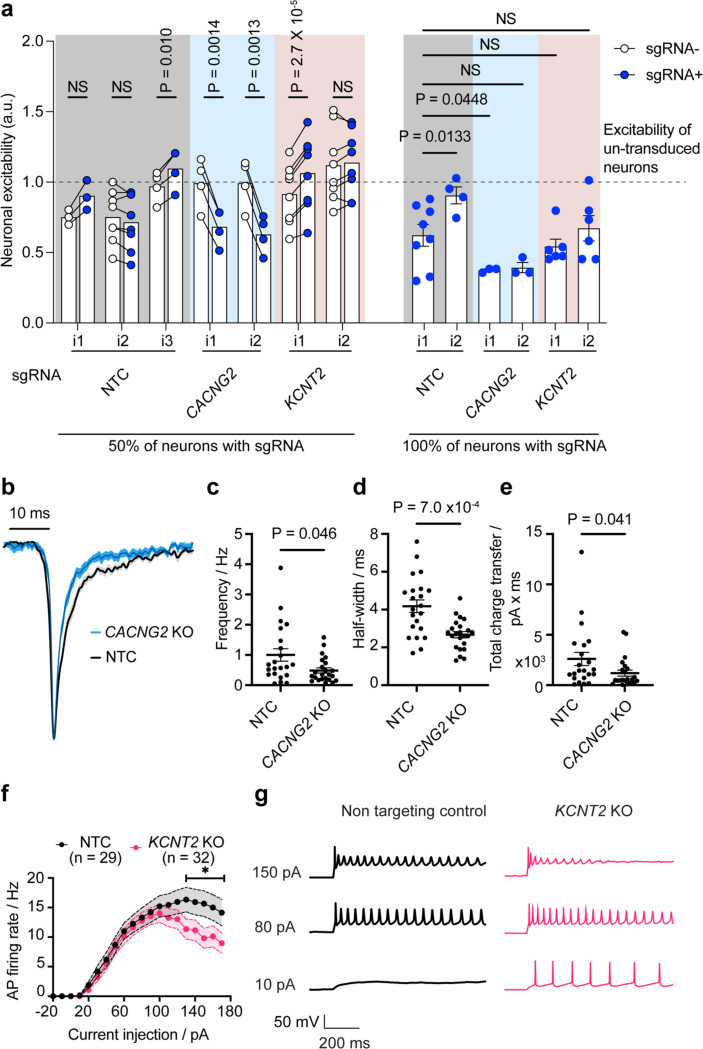
Understanding the complex interplay between gene expression and neuronal activity is crucial for unraveling the molecular mechanisms underlying cognitive function and neurological disorders. Here, we developed pooled screens for neuronal activity, using CRISPR interference (CRISPRi) and the fluorescent calcium integrator CaMPARI2. Using this screening method, we evaluated 1343 genes for their effect on excitability in human iPSC-derived neurons, revealing potential links to neurodegenerative and neurodevelopmental disorders. These genes include known regulators of neuronal excitability, such as TARPs and ion channels, as well as genes associated with autism spectrum disorder and Alzheimer's disease not previously described to affect neuronal excitability. This CRISPRi-based screening platform offers a versatile tool to uncover molecular mechanisms controlling neuronal activity in health and disease.


Conflict of interest statement

M.K. is a co-scientific founder of Montara Therapeutics and serves on the Scientific Advisory Boards of Engine Biosciences, Casma Therapeutics, Alector, and Montara Therapeutics, and is an advisor to Modulo Bio and Recursion Therapeutics. M.K. is an inventor on US Patent 11,254,933 related to CRISPRi and CRISPRa screening, and on a US Patent application on in vivo screening methods. M.T., X.H., A.C, C.G.J., C.E., and J.H. are employees of Genentech. S.C.B is currently employed at the Arc Institute (Palo Alto, CA).

Figures

Extended Data Figure 1.
Extended Data Figure 1.. CaMPARI2 reliably conveys AMPAR activation at the synapse without significant UV toxicity.
(a) CaMPARI2 dose response to glutamate. CaMPARI2 iNeurons were treated with TTX or various concentrations of glutamate (0, 1, 10, 30, 60, or 100 μM) and illuminated with UV to measure photoconversion of CaMPARI2. Photoconversion increased in a dose-dependent manner. (b) CaMPARI2 response to glutamate with co-treatment of GluR antagonists and TTX. CaMPARI2 activation is reduced to baseline (neurons treated with 1.5 μM TTX) when treated with APV and NBQX. Activation is not fully reduced to baseline with a full spectrum cocktail of mGluR antagonists, but is still lower than glutamate treatment alone. N = 6 independent culture wells. (c) CaMPARI2 dose response to KCl. CaMPARI2 iNeurons were treated with TTX, 30 μM glutamate, 0.1% DMSO or various concentrations of KCl (10, 30, 50, 100, 300, 500 mM) and illuminated with UV to measure photoconversion of CaMPARI2. Photoconversion increased in a dose-dependent manner to a peak at 50 mM, where a decline in photoconversion was observed at higher concentrations of KCl. (d) Quantification of CaMPARI2 red/green fluorescence ratio from (b). A non-linear fit could not be established, however the 50 mM KCl treatment was selected for later experiments due to the high conversion and range of response. N = 6 independent culture wells. (e) CaMPARI photoconversion in response to various UV durations. CaMPARI2 iNeurons were treated with TTX or various concentrations of glutamate (0, 1, 10, or 100 μM) and illuminated with UV for various durations of time (0, 1, 5, 10, or 15 min). After illumination, cells were dissociated for flow cytometry and analyzed. N = 5 independent culture wells. (f) Measuring effect of cell density on CaMPARI photoconversion. Significant deviations from optimal plating conditions had no significant effects on photoconversion upon TTX, vehicle, or glutamate treatment. N=4 independent culture wells. (g) Measuring UV toxicity in CaMPARI iNeurons. iNeurons were illuminated with UV for 0, 1, 5, 15, or 60 minutes and stained with Trypan Blue or TOPRO viability stain 5 minutes or 24 hours later to assess UV toxicity. N = 3 independent culture wells. (h) Measuring UV toxicity in CaMPARI iNeurons. CaMPARI iNeurons were illuminated with UV for 0, 1, 5, 15, or 30 minutes. Viability staining with TO-PRO-3 shows the proportion of viable cells after UV exposure. N = 9 independent culture wells. (i) Measuring glutamate toxicity. CaMPARI iNeurons were treated with 0, 1, 3, 10, 30, 50, 100 μM of glutamate for 5 minutes and UV illuminated for 5 minutes. TO-PRO-3 staining was performed to measure acute glutamate treatment toxicity. N = 3 independent culture wells.
Extended Data Figure 2.
Extended Data Figure 2.. iNeurons have heterogeneous responses to glutamate stimulation
(a) Representative voltage responses from the current-spike output recordings of the corresponding iNeurons in Figure 1f–h. (b) Current-spike output relationships for all recorded iNeurons in Figure 1f–h. N = 2–7 independent neurons per cell type, 18 neurons total. Shaded error bars are S.E.M. (c) Rheobase values for all recorded iNeurons in Figure 1f–h. N = 2–7 independent neurons per cell type, 18 neurons total. One-way ANOVA, p = 0.05. Error bars are S.E.M.
Extended Data Figure 3.
Extended Data Figure 3.. Results from Primary screen
(a) Volcano plot summarizing the effect of knockdowns on CaMPARI phenotypes and the determine statistical significance for targeted genes (Mann-Whitney U test). Dashed lines indicate a false-discovery rate (FDR) cutoff of 0.05, based on the phenotype score for gene calculated from 5 targeting sgRNAs. Black points indicate hit genes where knockdown changes CaMPARI red/green fluorescence ratio in response to glutamate stimulation, while grey points indicate non-hits. Genes related to synaptic transmission (purple) and ion transport (orange) are highlighted based on Gene Ontology terms. (b) Disease associated genes from DisGenNet and whole-exome sequencing (Satterstrom et al)9 overlap with hit genes from CaMPARI screen. (c) Scatterplot of gene scores from each replicate of the primary screen shown the correlation between screens. Pearson’s R = 0.49, linear regression fit depicted by solid black line.
Extended Data Figure 4.
Extended Data Figure 4.. Electrophysiology profiles of iNeurons with KCNT2 and CACNG2 knockdowns.
(a) Schematic of intra-well comparison experiments with 50% of CaMPARI2 iNeurons expressing a sgRNA for a target gene. A 1:1 ratio of iNeurons expressing the sgRNA: not expressing a sgRNA are seeded and differentiated. These are then treated with the same glutamate and photoconversion conditions. These are gated based on the presence of BFP in the sgRNA construct, and the CaMPARI2 ratio is directly compared between the two populations. (b) RT-qPCR shows the knock down efficiency of the sgRNAs targeting CACNG2 (blue) and KCNT2 (red). N = 4 biological replicates per condition. Error bars are SEM. (c) Sample sEPSC recordings from NTC (black trace) and CACNG2 KO (blue trace) iNeurons (d) CACNG2 KO iNeurons show a slight increase in sESPC amplitude that is not statistically significant. (NTC: 22 neurons, CACNG2 KO:23 neurons, Mann-Whitney test. (e-i) No differences between NTCs (N= 29 neurons) and KNCT2 KOs (N = 32 neurons) in either passive membrane properties or action potential kinetics. Error bars donate standard error.
Extended Data Figure 5.
Extended Data Figure 5.. Secondary CRISPRi screen strategies.
(a) Screening strategy. CRISPRi iPSCs were transduced with a pooled lentivirus sgRNA library consisting of hit genes from the primary screen (1622 sgRNAs targeting 424 genes). Exposure to puromycin selects for iPSCs successfully transduced with sgRNA construct. iPSCs were then differentiated into neurons via overexpression of NGN2 and cultured for 21 days. Neurons were then incubated with either 30 μM glutamate or 50 mM KCl, illuminated with UV light, and then separated by FACS into populations with high versus low red/green fluorescence ratios. (b) iPSCs were differentiated into neurons via overexpression of NGN2 and cultured for 21 days. Neurons were then incubated with 30 μM glutamate, 1.5 μM TTX, 10 μM NBQX, 50 μM APV, 100 μM LY367385, 0.1 μM LY341495, 1 μM CPPG, 1 μM MTEP. Neurons were then illuminated with UV light, and then separated by FACS into populations with high versus low red/green fluorescence ratios. (c) Survival of neurons was assessed by comparing sgRNA frequency in neurons at the start of differentiation (day 0) and after 21 days of differentiation. (d) iPSCs expressing sgRNAs were treated with 30 μM glutamate for 5 minutes, illuminated with UV light, and then separated by FACS into populations with high versus low red/green fluorescence ratios. (e) iPSCs expressing sgRNAs were differentiated into neurons and combined with Day 20 iAstrocytes. These co-cultures were grown for 21 days. Neurons were then treated 30 μM glutamate, illuminated with UV light, and then separated by FACS into populations with high versus low red/green fluorescence ratios. To assess the spontaneous activity of these cultures, no glutamate stimulation was applied.
Extended Data Figure 6.
Extended Data Figure 6.. Secondary CRISPRi screens reveal excitability phenotypes in iPSC neurons.
(a) CaMPARI2 neurons in coculture with iAstrocytes respond to glutamate in a dose-dependent manner. N = 4 independent culture wells per measurement. TTX (1.5 μM), NBQX (50 μM), and “no treatment” conditions did not contain glutamate. (b) Multielectrode arrays (MEA) recordings of spikes per minute of neuron-astrocyte cocultures and monoculture neurons. After 21 days of culture, more spikes are detected in cocultures. N = 6 independent culture wells, each with 16 electrodes. (c) Synchrony of neuronal activity in neuron-astrocyte cocultures on MEA as measured through Area Under a Normalized Cross Correlation. After recording on day 18 (dotted line), cultures were treated with 100 μM tetanus toxin (TeNT) or vehicle control. Loss of synchrony begins around 24 hours later in TeNT treated wells, while vehicle treated wells show a slight increase. N = 6 independent culture wells, with 16 electrodes per well. (d) Total spikes per minute of cultures from (c). Day 18 recording measured before addition of TeNT. N = 6 independent culture wells, with 16 electrodes per well. (e) Modifiers of activity of spontaneously firing neurons in coculture do not correlate with those of glutamate-stimulated neurons in coculture (Pearson’s R = −0.13) (f) Correlation matrix of gene scores from CaMPARI2 screens, using Pearson’s correlation. (g) Heatmap of gene scores in secondary screens. Each included gene is classified as a hit in at either the KCl or glutamate (monoculture and coculture) screens (FDR > 0.1) and is denoted with an asterisk when classified as a hit.
Extended Data Figure 7.
Extended Data Figure 7.. Validation of KDs from secondary screens
In cultures where 100% of CaMPARI2 iNeurons are expressing sgRNAs targeting NSD1 and PHF21A, these iNeurons lack statistically significant reduced neuronal excitability in response to glutamate stimulation observed in the screen relative to non-targeting controls. iNeurons expressing sgRNAs targeting PTEN show the expected increase in activity. For iNeurons expressing sgRNAs targeting GRIA2 and PICALM, the expected screen phenotype is not preserved when 100% of the cells have the knockdown. CaMPARI2 ratios are normalized to neuron samples that do not receive a sgRNA and are run on the flow cytometer on the same day. N = 2–8 independent culture wells per experiment. Each individual experiment was normalized to the excitability (CaMPARI2 response) of wells where neurons did not receive a sgRNA. Error bars denote standard error. P values calculated by ANOVA, using NTC_i1 as reference. P > 0.05 = not significant (NS).
Extended Data Figure 8.
Extended Data Figure 8.. CROP-seq reveals transcriptional changes to genes involved in synaptic processes drive changes in excitability.
(a) Leiden clustering of neurons from CROP-seq classified into 3 clusters. (b) Log(1+P) genes detected in each cell. (c) Log(1+P) total read counts in each cell. (d) Percentage of mitochondrial genes detected in each cell. (e) Percentage of ribosomal genes detected in each cell. (f) Heatmap of cluster shift analysis for each knockdown. Color values are expressed as the percent change in abundance of the knockdown in each cluster relative to non-targeting controls. Asterisks denote significant enrichments and depletions (adjusted q-value < 0.05). (g) Heatmap of differentially expressed genes (DEGs, versus non-targeting controls, adjusted p-value < 0.05) of knockdowns with significant on-target KD. Clustering shows consistency between individual sgRNAs targeting the same gene. SNLP is signed negative log of the adjusted p-value. Knockdowns with >10 DEGs are shown. (h) sgRNA representation by number of neurons detected in scRNA-seq data post quality control filtering and with a sgRNA MOI of one. (i) Plot of on-target KD versus base mean expression for each sgRNA. Lower expression of genes generally resulted less ability to call significance.
Figure 1.
Figure 1.. CaMPARI2 captures glutamate receptor activation in iPSC-derived glutamatergic neurons.
(a) Strategy for generating CRISPRi-NGN2-CaMPARI2 iPSC line: NGN2 and dCAS9-KRAB was stably integrated into the AAVS1 and CLYBL loci, respectively, as described previously.17 CAG promoter-driven CaMPARI2 was randomly inserted into the genome via lentiviral integration. UCOE: Ubiquitous Chromatin Opening Element, WPRE: Woodchuck Hepatitis Virus Posttranscriptional Regulatory Element. (b) Experimental workflow of CaMPARI2 photoconversion assay in glutamatergic NGN2 neurons. (c) Representative fluorescence micrographs of iPSC-neurons expressing CaMPARI2 following incubation with 1.5 μM tetrodotoxin (TTX), vehicle (0.1% DMSO), or 30 μM glutamate for 5 minutes and illumination with 405 nm light. Nuclei were stained with Hoechst 33342. Unconverted CaMPARI2 persists in the soma and neurites, and converted CaMPARI2 is only observed with high signal after incubation with 30 μM glutamate. Merged micrographs show colocalization of nuclei (blue), CaMPARI2 (green), and converted CaMPARI2 (magenta). Scale bar is 20 μm. (d) CaMPARI2 neurons respond to glutamate in a dose-dependent manner. N = 6 independent culture wells per measurement. “No UV”, TTX (1.5 μM), and “no treatment” conditions did not contain glutamate. (e) Co-incubation of glutamate with AMPA receptor (10 μM NBQX), but not NMDA receptor (50 μM APV), antagonists attenuate CaMPARI2 photoconversion, suggesting that AMPA receptor activation is the primary mechanism of calcium influx. N = 6 independent culture wells per measurement. Unpaired t-test, * = P <0.0001. Error bars are SEM. (f) Representative current clamp recordings from four different cell types. The orange shaded area indicates the 5-minute window when 30 μM glutamate was applied to the recording chamber. The blue shaded area highlights the zoomed-in view shown in (g) for each trace. (g) From top to bottom, a zoomed-in view of the blue shaded areas from (f) for Cell types A to D. (h) Percentage of each cell type from recorded iNeurons. N = 18 neurons.
Figure 2.
Figure 2.. CRISPR interference (CRISPRi) screening with CaMPARI2 reveals genetic modifiers of neuronal excitability in iPSC derived neurons.
(a) Screening strategy using CaMPARI2 as readout for neuronal excitability. CRISPRi iPSC expressing CaMPARI2 were transduced with a lentiviral sgRNA library focused on genes annotated for neuronal activity, neurodegenerative disease, or neurodevelopmental disorders (7449 sgRNA constructs targeting 1343 genes). Exposure to puromycin selects for iPSCs successfully transduced with sgRNA construct. iPSCs were then differentiated into neurons via overexpression of NGN2 and cultured for 21 days. Neurons were then incubated with 30 μM glutamate for five minutes, illuminated with UV light for five minutes, and then separated by FACS into high and low red/green fluorescence ratio populations. Frequency of neurons expressing sgRNAs were determined by next-generation sequencing for high and low red/green ratio neuronal populations and hit genes were identified. (b) Volcano plot summarizing the effect of knockdowns on CaMPARI phenotypes and the determine statistical significance for targeted genes (Mann-Whitney U test). Dashed lines indicate a false-discovery rate (FDR) cutoff of 0.05, based on the phenotype score for genes calculated from 5 targeting sgRNAs. Red and blue points indicate hit genes where knockdown increases and decreases CaMPARI2 red/green fluorescence ratio, respectively, in response to glutamate stimulation. Grey points indicate non-hits. Large colored dots indicate hit genes that were found in the enriched GO terms in (d). (c) Disease-associated genes that influenced excitability in the CaMPARI2 screen. (d) Over-representation analysis (ORA) using Webgestalt indicates gene ontology (GO) annotation terms that describe genes enriched in the low (blue) and high (red) CaMPARI2 ratio from the screening library.
Figure 3.
Figure 3.. CACNG2 and KCNT2 modify excitability in human neurons.
(a) CaMPARI2 neurons expressing sgRNAs targeting CACNG2 have reduced neuronal excitability in response to glutamate stimulation. This effect is observed intra-well, where CACNG2 sgRNA-containing neurons have a lower CaMPARI2 ratio than those that do not receive the sgRNA, and inter-well, in cultures in which 100% of the neurons are expressing the sgRNA. One of the sgRNAs targeting KCNT2 shows an increase in neuronal excitability when comparing intra-well effects, which matches the screening phenotype. In cultures where 100% of the neurons are expressing one of the sgRNAs targeting KCNT2, there is an unexpected decrease in the observed neuronal excitability. CaMPARI2 ratios are normalized to neuron samples that do not receive a sgRNA and are run on the flow cytometer on the same day. 50% knockdown cultures : N = 3–8 independent culture wells per experiment. Each individual experiment was normalized to the excitability (CaMPARI2 response) of wells where neurons did not receive a sgRNA. For intra-well comparisons, a paired ratio t-test between sgRNA- and sgRNA+ populations were performed for each sgRNA. The calculated P values are corrected for multiple hypothesis (Holm-Šídák method). For inter-well comparisons, P values were calculated by ANOVA, using NTC_i1 as reference. P > 0.05 = not significant (NS). (b) The spontaneous excitatory postsynaptic currents (sEPSCs) in CACNG2 KO iNeurons demonstrate accelerated kinetics and a decrease in overall charge transfer. Averaged and normalized sEPSCs from all the recorded instances of NTCs (N = 22, in black) and CACNG2 KOs (N = 23, in blue), with the shaded area indicating standard errors. (c) CACNG2 KOs exhibit reduced sEPSC frequency, (d) half-width, and (e) total charge transfer (Mann-Whitney test). NTCs (N = 22) and CACNG2 KOs (N = 23). Error bars denote standard error. (f) KCNT2 KO neurons exhibit premature action potential failure. Current-spike output relationship presenting a diminished action potential firing rate in KCNT2 KOs (N = 32) at high current injection amplitudes, as juxtaposed against non-targeting controls (N = 29). The differences were statistically significant for current injection steps greater than 120 pA (asterisk donates p values as follows: 130 pA: p = 0.01, 140 pA : p = 0.02, 150 pA: p <0.01, 160 pA: p = 0.02, 170 pA: p = 0.01 ; two-way ANOVA with multiple comparisons). (g) Sample recordings from both NTCs and KCNT2 KOs illustrating voltage responses of neurons to varying degrees of current injection.
Figure 4.
Figure 4.. Secondary CRISPRi screens reveal excitability phenotypes in iPSC neurons.
(a) Comparison of gene scores across different screens. Gene scores of knockdowns in the primary and secondary screens with glutamate stimulation show a positive correlation (Pearson’s R = 0.60). (b) Many hit genes show similar phenotypes in neurons depolarized with KCl compared to those stimulated with glutamate (Pearson’s R = 0.33). (c) Glutamate receptor antagonists mostly abrogate phenotypes in neurons stimulated with glutamate, as reflected by a weak correlation of gene scores (Pearson’s R = −0.004) (d) Excitability phenotypes in glutamate-stimulated neurons are not strongly correlated with survival phenotypes (Pearson’s R = 0.064). (e) Modifiers of activity of spontaneously firing neurons in coculture do not correlate with those of glutamate-stimulated neurons in monoculture (Pearson’s R = −0.07). (f) Gene scores of knockdowns in the secondary screens with glutamate stimulation in monoculture and coculture show a positive correlation (Pearson’s R = 0.36).
Figure 5.
Figure 5.. Flow validation of disease-associated excitability hit genes.
(a) CaMPARI2 neurons expressing sgRNAs targeting genes that, when knocked down, reduced neuronal excitability in response to glutamate stimulation in the secondary screens. This effect is observed intra-well, where sgRNA-containing neurons have a lower CaMPARI2 ratio than those that did not receive a sgRNA. Non-targeting controls (NTCs) are the same as in Figure 3A. Paired ratio t-test made between neuron populations receiving sgRNA (sgRNA+) and not receiving guide (sgRNA-). N = 3–6 independent culture wells per measurement. Each individual experiment was normalized to the excitability (CaMPARI2 response) of wells where neurons did not receive a sgRNA. For intra-well comparisons, a paired ratio t-test between sgRNA- and sgRNA+ populations were performed for each sgRNA. The calculated P values were corrected for multiple hypotheses (Holm-Šídák method). (b) CaMPARI2 neurons expressing sgRNAs targeting genes that, when knocked down, increased neuronal excitability in response to glutamate stimulation in the secondary screens. This effect is observed intra-well, where sgRNA containing neurons have a higher CaMPARI2 ratio than those that do not receive a sgRNA. Non-targeting controls (NTCs) are the same as in Figure 3A and Figure 5A . Paired ratio t-test made between neuron populations receiving sgRNA (sgRNA+) and not receiving guide (sgRNA-). N = 3–6 independent culture wells per measurement. Each individual experiment was normalized to the excitability (CaMPARI2 response) of wells where neurons did not receive a sgRNA. For intra-well comparisons, a paired ratio t-test between sgRNA- and sgRNA+ populations were performed for each sgRNA. The calculated P values were corrected for multiple hypotheses (Holm-Šídák method). (c) PICALM KOs exhibit a reduced rectification index (the ratio of current magnitude at +40 mV vs −70 mV) relative to NTC, suggesting an increased presence of synaptic calcium permeable AMPA receptors. The traces represent the mean and standard error of all sEPSC recordings from NTC and PICALM KO iNeurons and are shown normalized to the average −70 mV sEPSC for each neuron. (N = 15 NTC, 13 PICALM KO). (d) PICALM KOs displayed a decreased rectification index as compared to NTCs (N = 15 and 13 neurons for NTCs and PICALM KOs, respectively; analyzed using the Mann-Whitney test). Error bars donate standard error. (e) Sample sEPSC recordings from representative NTC and PICALM KO iNeurons.
Figure 6.
Figure 6.. CROP-seq reveals transcriptional changes to genes involved in synaptic processes drive changes in excitability.
(a) Marker gene expression is homogenous across clusters and suggests that neuronal identity is conserved. (b) On-target knockdown of target genes and the corresponding sgRNAs. Red bars indicated a significant KD in comparison to NTCs, while grey bars did not reach significance. (c) Number of significantly differentially expressed genes for each detected sgRNA. Each sgRNA was compared separately to the group of five non-targeting control (NTC) sgRNAs, and significance was determined at a threshold of and adjusted p-value <0.05. (d) MA plot of TRIP12 knockdown, showing genes (colors indicate associated GO term in Figure 6e) related to synaptic transmission and synapse organization. (e) GO term (Biological Processes) enrichment analysis of upregulated (red) and downregulated genes in TRIP12 KD (f) GO term (SynGO) enrichment analysis of upregulated (red) and downregulated genes in TRIP12 (g) MA plot of PTEN knockdown, showing an upregulation of synaptic processes and downregulation of microtubule organization and polymerization. Genes are colored ti indicate associated GO term in Figure 6h. (h) GO term (Biological Processes) enrichment analysis of upregulated (red) and downregulated genes in PTEN KD.

References

    1. Scala F. et al. Phenotypic variation of transcriptomic cell types in mouse motor cortex. Nature 598, 144–150 (2021). - PMC - PubMed
    1. BRAIN Initiative Cell Census Network (BICCN). A multimodal cell census and atlas of the mammalian primary motor cortex. Nature 598, 86–102 (2021). - PMC - PubMed
    1. Ecker J. R. et al. The BRAIN Initiative Cell Census Consortium: Lessons Learned toward Generating a Comprehensive Brain Cell Atlas. Neuron 96, 542–557 (2017). - PMC - PubMed
    1. Yuste R. et al. A community-based transcriptomics classification and nomenclature of neocortical cell types. Nat Neurosci 23, 1456–1468 (2020). - PMC - PubMed
    1. Jorstad N. L. et al. Transcriptomic cytoarchitecture reveals principles of human neocortex organization. Science 382, eadf6812 (2023). - PMC - PubMed

Publication types

LinkOut - more resources