

This is a preprint.
A General Framework for Branch Length Estimation in Ancestral Recombination Graphs
- PMID: 39990503
- PMCID: PMC11844452
- DOI: 10.1101/2025.02.14.638385
A General Framework for Branch Length Estimation in Ancestral Recombination Graphs
Abstract
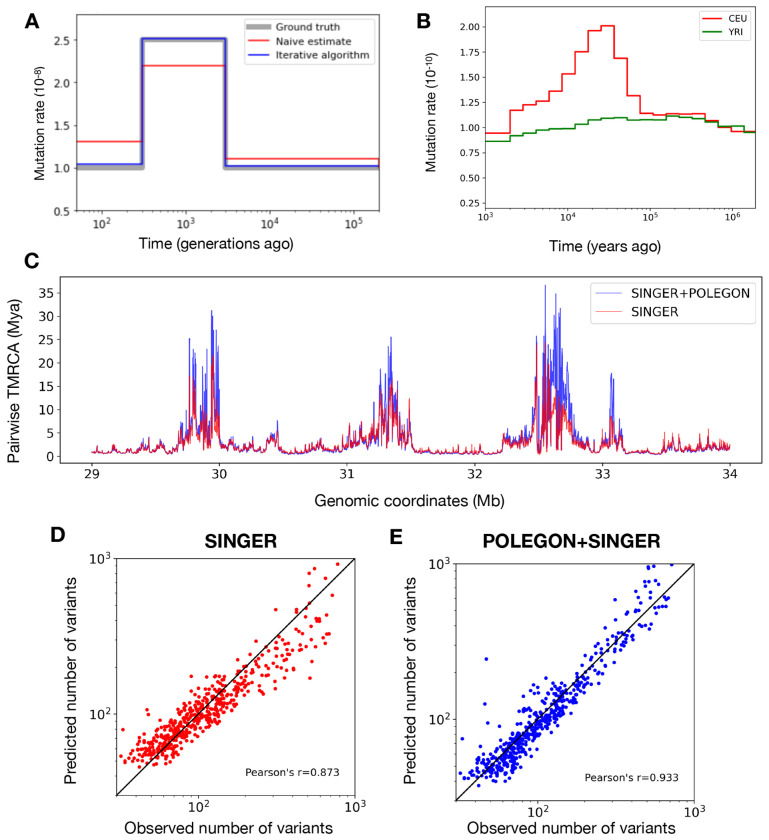
Inference of Ancestral Recombination Graphs (ARGs) is of central interest in the analysis of genomic variation. ARGs can be specified in terms of topologies and coalescence times. The coalescence times are usually estimated using an informative prior derived from coalescent theory, but this may generate biased estimates and can also complicate downstream inferences based on ARGs. Here we introduce, POLEGON, a novel approach for estimating branch lengths for ARGs which uses an uninformative prior. Using extensive simulations, we show that this method provides improved estimates of coalescence times and lead to more accurate inferences of effective population sizes under a wide range of demographic assumptions. It also improves other downstream inferences including estimates of mutation rates. We apply the method to data from the 1000 Genomes Project to investigate population size histories and differential mutation signatures across populations. We also estimate coalescence times in the HLA region, and show that they exceed 30 million years in multiple segments.
Figures
Similar articles
-
The Promise of Inferring the Past Using the Ancestral Recombination Graph.Genome Biol Evol. 2024 Feb 1;16(2):evae005. doi: 10.1093/gbe/evae005. Genome Biol Evol. 2024. PMID: 38242694 Free PMC article.
-
Evaluation of methods for estimating coalescence times using ancestral recombination graphs.Genetics. 2022 May 5;221(1):iyac044. doi: 10.1093/genetics/iyac044. Genetics. 2022. PMID: 35333304 Free PMC article.
-
Bayes estimation of species divergence times and ancestral population sizes using DNA sequences from multiple loci.Genetics. 2003 Aug;164(4):1645-56. doi: 10.1093/genetics/164.4.1645. Genetics. 2003. PMID: 12930768 Free PMC article.
-
Ancestral Population Genomics.Methods Mol Biol. 2019;1910:555-589. doi: 10.1007/978-1-4939-9074-0_18. Methods Mol Biol. 2019. PMID: 31278677 Review.
-
Perspective: gene divergence, population divergence, and the variance in coalescence time in phylogeographic studies.Evolution. 2000 Dec;54(6):1839-54. doi: 10.1111/j.0014-3820.2000.tb01231.x. Evolution. 2000. PMID: 11209764 Review.
References
-
- Cook S.R., Gelman A., Rubin D.B., 2006. Validation of software for bayesian models using posterior quantiles. Journal of Computational and Graphical Statistics 15, 675–692.
-
- Dempster A.P., Laird N.M., Rubin D.B., 1977. Maximum likelihood from incomplete data via the em algorithm. Journal of the royal statistical society: series B (methodological) 39, 1–22.
Publication types
Grants and funding
LinkOut - more resources
Full Text Sources
Research Materials