. 2025 Jan 27;21(4):1513-1529.
doi: 10.7150/ijbs.100176. eCollection 2025.

Inhibition of GRK2-PDE4D Axis Suppresses Fibroblast-Like Synoviocytes Hyperplasia and Alleviates Experimental Arthritis

Affiliations

Inhibition of GRK2-PDE4D Axis Suppresses Fibroblast-Like Synoviocytes Hyperplasia and Alleviates Experimental Arthritis

Dafei Han et al. Int J Biol Sci. .

Abstract

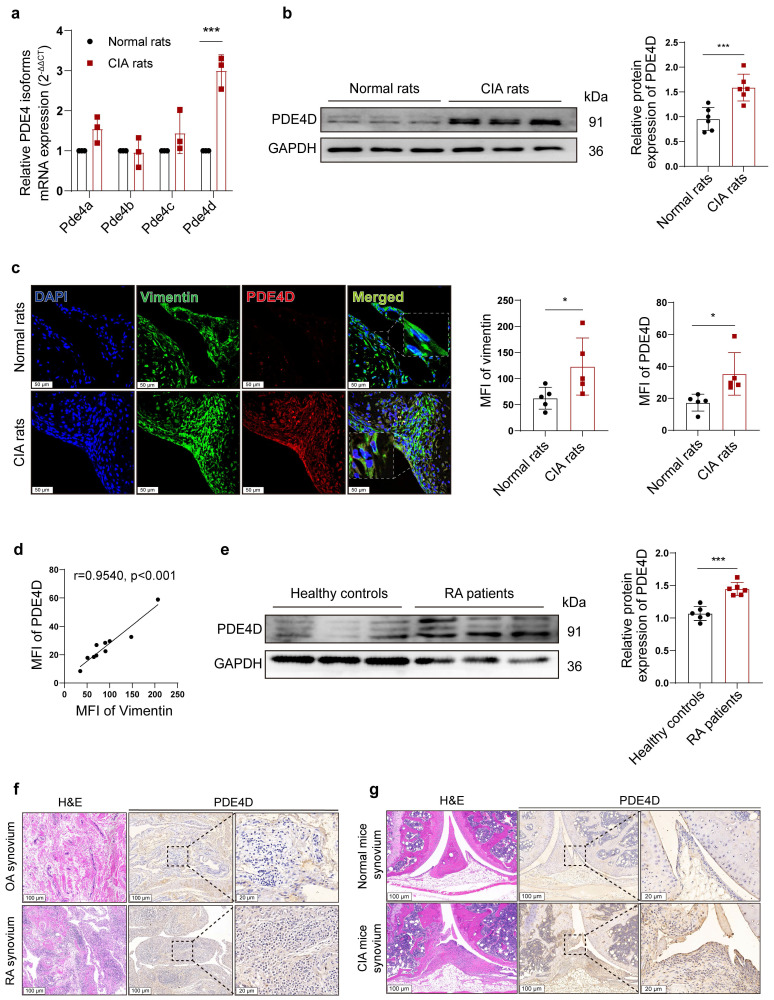
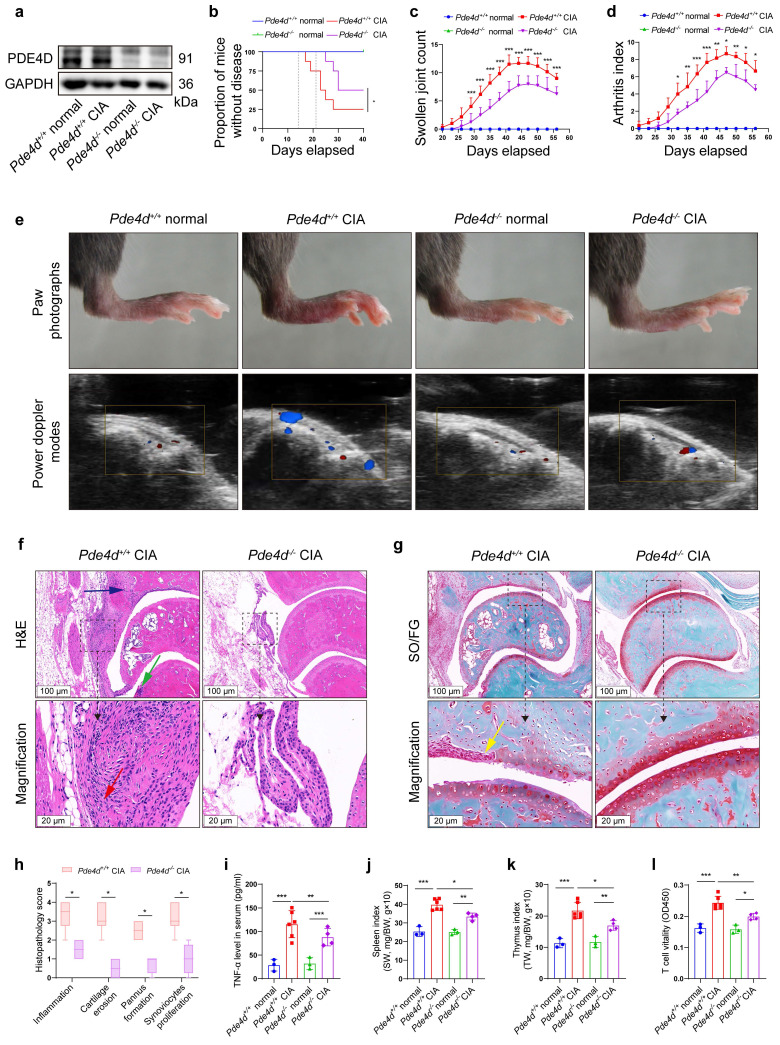
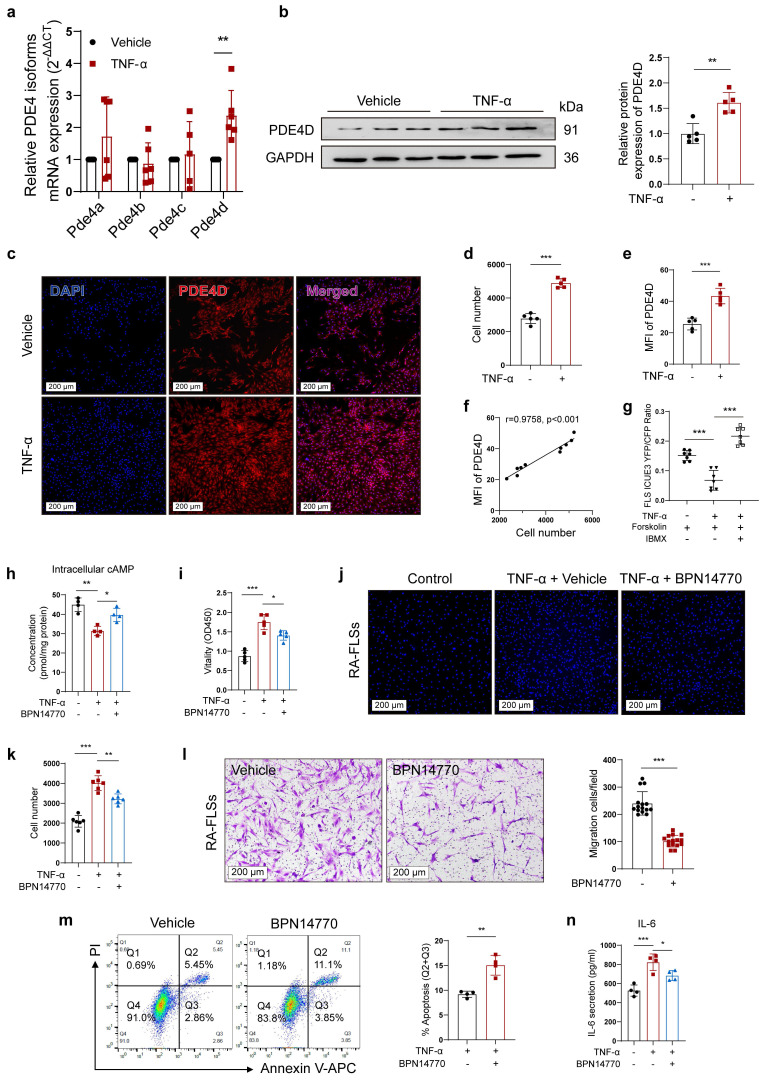
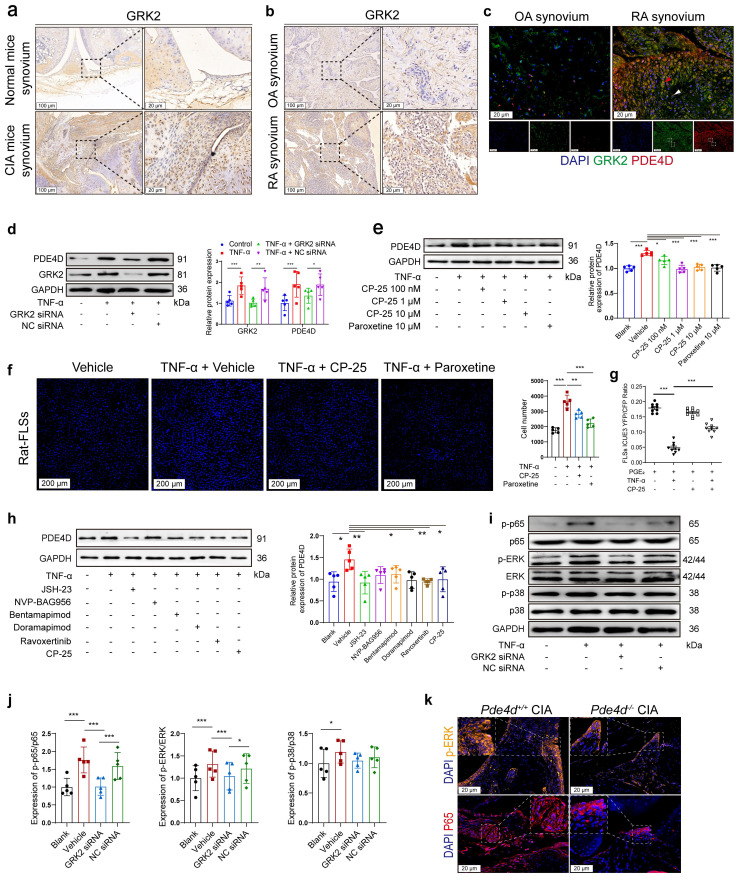
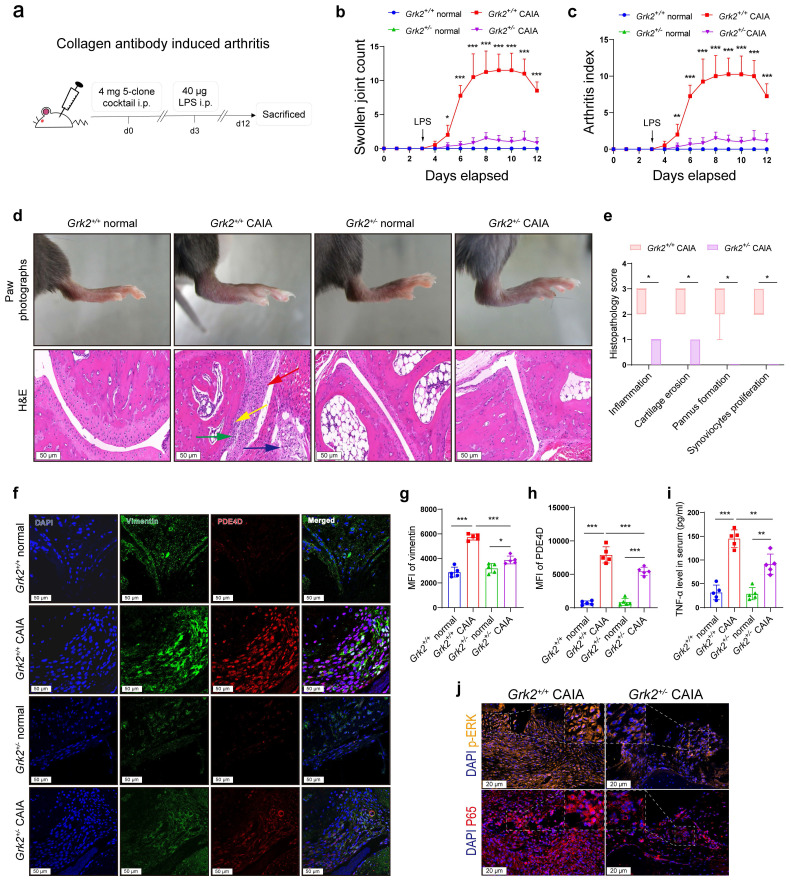
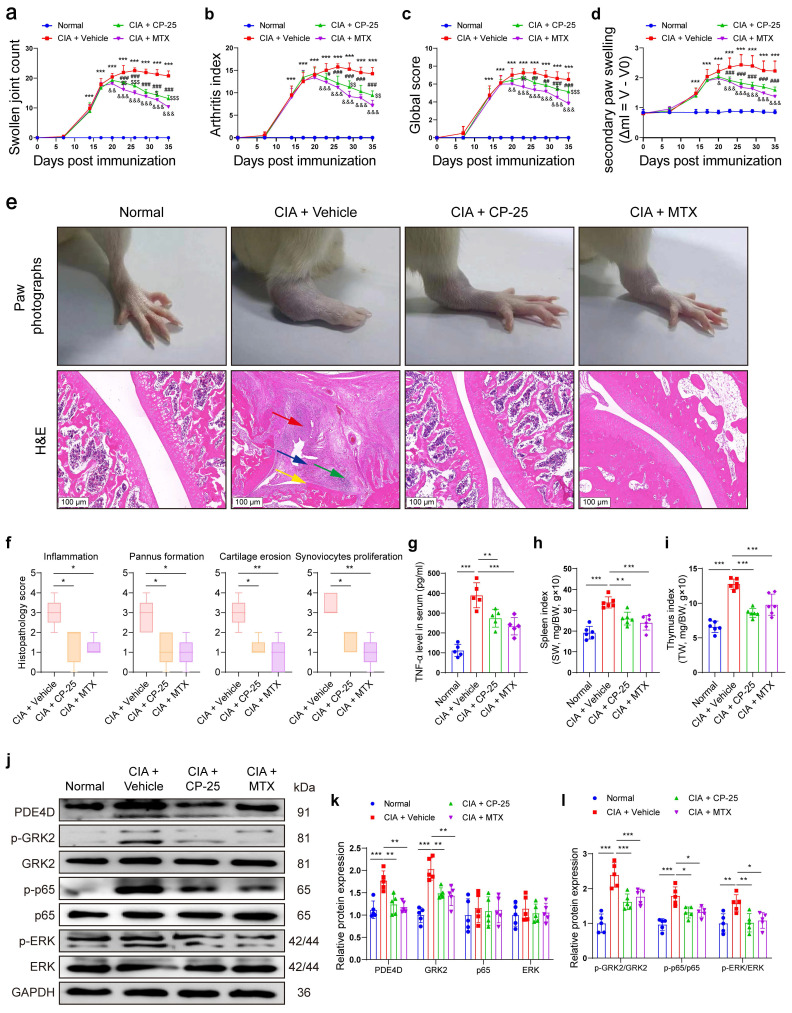
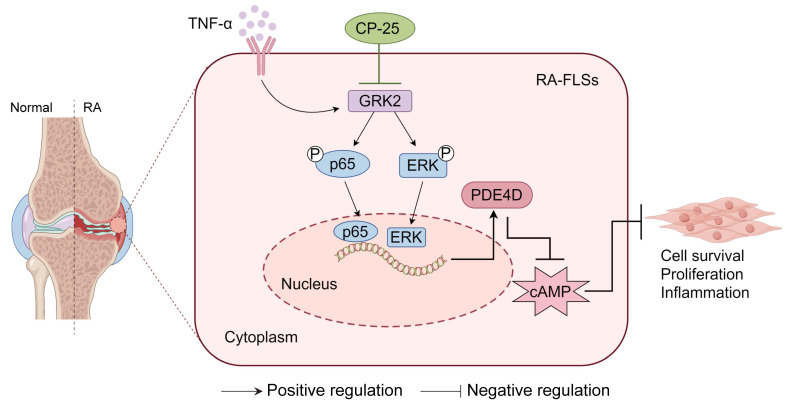
PDE4D has been reported to exhibit significantly elevated levels in the synovium of RA patients compared with OA, yet its role in RA remains underexplored. This study aimed to elucidate the role of the GRK2-PDE4D axis in FLSs and explore its potential as a therapeutic target for RA. Abundant expression of both PDE4D and GRK2 was observed in synovial tissues from both experimental arthritis animals and RA patients, with synchronized expression noted in RA patients. Global deletion of Pde4d reduced disease incidence and alleviated arthritis in CIA mice. TNF-α upregulated PDE4D expression, causing abnormal FLSs activation and hyperproliferation. Inhibiting PDE4D restored cAMP levels, thereby reducing FLSs hyperproliferation, migration, and anti-apoptosis. Mechanistically, TNF-α-induced PDE4D upregulation was dependent on GRK2. Inhibition of GRK2 with CP-25, an esterification modification of paeoniflorin, reduced PDE4D expression and FLSs proliferation, while restoring cAMP levels. Both genetic deficiency and pharmacological inhibition of GRK2 decreased PDE4D expression, ameliorating arthritis severity in animal models. This is the first study to investigate the role of PDE4D in RA and to clarify that it can be regulated by GRK2. These findings suggest that targeting the GRK2-PDE4D axis represents a promising therapeutic strategy for RA.

Keywords: CP-25; Fibroblast-like synoviocytes; G protein coupled receptor kinase 2; Phosphodiesterase 4D; Rheumatoid arthritis.


Conflict of interest statement

Competing Interests: The authors have declared that no competing interest exists.

Figures

Figure 1
Figure 1
Expression of PDE4D in experimental arthritis models and patients with RA. (a) Transcript analysis of PDE4 isoforms in FLSs from synovial tissues of normal and CIA rats. n = 3. (b) Immunoblot analysis and quantification of PDE4D protein expression in FLSs from synovial tissues of normal and CIA rats. n = 6. (c) Representative IF (left) and quantification (right) of vimentin and PDE4D in synovial tissues of normal and CIA rats. n = 5. (d) Correlation analysis of vimentin MFI with PDE4D MFI in CIA mice synovial tissues. Two-tailed Spearman correlation test. (e) Immunoblot analysis and quantification of PDE4D protein expression in FLSs from synovial tissues of healthy controls and RA patients. n = 6. (f) Representative H&E staining images (rightmost) and IHC staining analysis of PDE4D protein expression in synovium of OA and RA patients. (g) Representative H&E staining images (rightmost) and IHC staining analysis of PDE4D protein expression in synovium of normal and CIA mice. Data are presented as mean ± SD from at least three independent experiments. *p < 0.05 and ***p < 0.001.
Figure 2
Figure 2
Pde4d deletion reduced arthritis severity in CIA mice. (a) Hind paws from normal and CIA mice were homogenized in cell lysis buffer, and PDE4D protein was detected by immunoblot, n = 4. (b) Arthritis incidence in CIA and normal mice. Logrank (Mantel-Cox) test. (c) Swollen joint count and (d) arthritis index of mice was recorded from the 20th day to the 56th day after the first immunization. n = 3-6. (e) Representative photographs of paws (upper) and power Doppler signals which reflecting vascularization and blood flow of synovium (lower) in different groups. (f) Representative images of H&E and (g) SO/FG staining of ankle joint sections from Pde4d+/+ and Pde4d-/- CIA mice on the 56th day after the first immunization. Histopathologic changes include synovial hyperplasia (red arrowhead), pannus (blue arrowhead), infiltrating inflammatory cells (green arrowhead), and cartilage destruction (yellow arrowhead). (h) The histopathologic score inflammation, cartilage erosion, pannus formation, and synoviocytes proliferation of Pde4d+/+ and Pde4d-/- CIA mice. n = 4-6. (i) The levels of TNF-α in mice serum were measured by ELISA. n = 3-6. (j) Spleen index (spleen weight (SW, mg)/bodyweight (BW, g) ×10) and (k) thymus index (thymus weight (TW, mg)/bodyweight (BW, g) ×10) in different groups. n = 3-6. (l) T cells vitality in different groups detected by CCK-8. n = 3-6. Data are presented as mean ± SD from at least three independent experiments. *p < 0.05, **p < 0.01 and ***p < 0.001.
Figure 3
Figure 3
Inhibiting PDE4D significantly ameliorated TNF-α-induced arthritis phenotypes of FLSs. a-f, normal rat-FLSs were isolated and stimulated with TNF-α (20 ng/ml) or vehicle for 48 h. (a) Transcript analysis of PDE4 isoforms in FLSs. n = 6. (b) Immunoblot analysis and quantification of PDE4D protein expression in FLSs. n = 5. (c) Representative IF staining of DAPI and PDE4D, (d) quantification of cell number by HCCIS, and (e) MFI of PDE4D in FLSs. n = 5. (f) Correlation analysis of cell number with PDE4D MFI. Two-tailed Spearman correlation test. (g) cAMP contents in rat-FLSs after TNF-α, Forskolin or IBMX treatment were detected by FRET. n = 7. h-k and m-n, RA-FLSs were stimulated with TNF-α (20 ng/ml) and treated with BPN14770 for 48 h. (h) Intracellular cAMP contents in FLSs were detected by ELISA. n = 4. (i) Cellular vitality of FLSs detected by CCK-8. n = 5. (j) Representative images of cell number and (k) quantification of FLSs detected by HCCIS. n = 5. (l) Migration of RA-FLSs assessed and counted from six different patients and performed in triplicate after treatment with Vehicle and BPN14770. Five different fields were selected for cell counting. n = 6. (m) Representative flow cytometry plots and quantification of apoptotic FLSs. n = 4. (n) Concentrations of IL-6 in supernatant were measured by ELISA. n = 4. Data are presented as mean ± SD from at least three independent experiments. *p < 0.05, **p < 0.01 and ***p < 0.001.
Figure 4
Figure 4
Overexpressed PDE4D in TNF-α-treated FLSs was mediated by GRK2. (a) Representative images of IHC staining of GRK2 from the synovium of normal and CIA mice. (b) Representative images of IHC staining of GRK2 from the synovium of OA and RA patients. (c) Representative double-staining IF of PDE4D and GRK2 from the synovium of OA and RA patients. (d) Immunoblot analysis and quantification of PDE4D and GRK2 protein expression in rat-FLSs after transfected with GRK2 siRNA and NC siRNA. n = 5. (e) Immunoblot analysis and quantification of PDE4D protein expression in rat-FLSs after treated with GRK2 inhibitors. n = 5. (f) Representative images of cell number (left) and quantification (right) of rat-FLSs after treated with GRK2 inhibitors detected by HCCIS. n = 5. (g) cAMP contents in rat-FLSs after treated with PGE2, TNF-α and CP-25 were detected by FRET. n = 9. (h) Immunoblot analysis and quantification of PDE4D protein expression in rat-FLSs after treated with different pathway inhibitors. n = 5. (i) Immunoblot analysis and quantification (j) of p-p65, p65, p-ERK, ERK, p-p38, and p38 protein expression in rat-FLSs after transfected with GRK2 siRNA and NC siRNA. n = 5. (k) Representative p-ERK and P65 IF staining in the synovium of CIA mice. Data are presented as mean ± SD from at least three independent experiments. *p < 0.05, **p < 0.01 and ***p < 0.001.
Figure 5
Figure 5
Grk2-deficient mice relieved symptoms in CAIA. (a) Male Grk2+/+ and Grk2+/- mice were used to establish a CAIA mouse model as indicated. (b) Swollen joint count and (c) arthritis index of mice were recorded from the 0th day to the 12th day after intraperitoneal injection of mouse monoclonal anti-collagen-II 5-clone antibody cocktail. n = 5. (d) Representative photographs of paws (upper) and H&E staining (lower) of the ankle joint sections from different groups. Histopathologic changes include synovial hyperplasia (red arrowhead), pannus (blue arrowhead), infiltrating inflammatory cells (green arrowhead), and cartilage destruction (yellow arrowhead). (e) Histopathological score of inflammation, cartilage erosion, pannus formation, and synoviocytes proliferation of Grk2+/+ and Grk2+/- CAIA mice. n = 5. (f) Representative double-staining IF of PDE4D and GRK2 from the synovial tissues of normal and CAIA mice. (g) Quantification of vimentin and (h) PDE4D MFI in the synovial tissues of normal and CAIA mice. n = 5. (i) The levels of TNF-α in mice serum were measured by ELISA. n = 5. (j) Representative p-ERK and P65 IF staining in the synovium of CAIA mice. Data are presented as mean ± SD from at least five independent experiments. *p < 0.05, **p < 0.01 and ***p < 0.001.
Figure 6
Figure 6
Pharmacological inhibition of GRK2 attenuated symptoms of CIA rats. Rats immunized with CII/CFA were randomly assigned to CIA + Vehicle, CIA + CP-25 and CIA + MTX. (a) Swollen joint count, (b) arthritis index, (c) global score, and (d) secondary paw swelling of mice were recorded from the 0th day to the 35th day after the first immunization. ***p < 0.001 versus normal group; #p < 0.05, ##p < 0.01 and ###p < 0.001 versus CIA model group; &p < 0.05, &&p < 0.01 and &&&p < 0.001 versus CIA model group; $p < 0.05, $$p < 0.01 and $$$p < 0.001 versus MTX group. n = 6. (e) Representative photographs of paws (upper) and H&E staining (lower) of the ankle joint sections from different groups. Histopathologic changes include synovial hyperplasia (red arrowhead), pannus (blue arrowhead), infiltrating inflammatory cells (green arrowhead), and cartilage destruction (yellow arrowhead). (f) Histopathological score of inflammation, pannus formation, cartilage erosion, and synoviocytes proliferation in different groups. n = 5. (g) The levels of TNF-α in rat serum were measured by ELISA. n = 5. (h) Spleen index (spleen weight (SW, mg)/bodyweight (BW, g) ×10) and (i) thymus index (thymus weight (TW, mg)/bodyweight (BW, g) ×10) in different groups. n = 6. (j) Immunoblot analysis and quantification (k and l) of PDE4D, p-GRK2, GRK2, p-p65, p65, p-ERK, and ERK protein expression from synovial tissues of different groups. n = 5. Data are presented as mean ± SD from at least five independent experiments. *p < 0.05, **p < 0.01 and ***p < 0.001.
Figure 7
Figure 7
A schematic illustration summarizing the regulation and function of the GRK2-PDE4D axis in RA-FLSs. TNF-α-stimulated GRK2 increases PDE4D expression via the p65 and ERK pathways, resulting in a decrease in cAMP concentration and the promotion of FLSs proliferation. CP-25 inhibits the GRK2-PDE4D axis, thereby suppressing hyperproliferation of FLSs and alleviating experimental arthritis. The figure was created using Figdraw.

Similar articles

References

    1. Van der Woude D, van der Helm-van Mil AHM. Update on the epidemiology, risk factors, and disease outcomes of rheumatoid arthritis. Best Pract Res Clin Rheumatol. 2018;32:174–87. - PubMed
    1. Raker VK, Becker C, Steinbrink K. The cAMP Pathway as Therapeutic Target in Autoimmune and Inflammatory Diseases. Front Immunol. 2016;7:123. - PMC - PubMed
    1. He Y, Huang Y, Mai C, Pan H, Luo HB, Liu L. et al. The immunomodulatory role of PDEs inhibitors in immune cells: therapeutic implication in rheumatoid arthritis. Pharmacol Res. 2020;161:105134. - PubMed
    1. Tai Y, Huang B, Guo PP, Wang Z, Zhou ZW, Wang MM. et al. TNF-alpha impairs EP4 signaling through the association of TRAF2-GRK2 in primary fibroblast-like synoviocytes. Acta Pharmacol Sin. 2022;43:401–16. - PMC - PubMed
    1. Chang Y, Wei W, Zhang L, Xu HM. Effects and mechanisms of total glucosides of paeony on synoviocytes activities in rat collagen-induced arthritis. J Ethnopharmacol. 2009;121:43–8. - PubMed

MeSH terms

Substances

LinkOut - more resources