. 2025 Feb 10;21(4):1749-1766.
doi: 10.7150/ijbs.99194. eCollection 2025.

Febuxostat therapy improved the outcomes of cardiorenal syndrome rodent through alleviating xanthine oxidase-induced oxidative stress and mitochondrial dysfunction

Affiliations

Febuxostat therapy improved the outcomes of cardiorenal syndrome rodent through alleviating xanthine oxidase-induced oxidative stress and mitochondrial dysfunction

Chih-Chao Yang et al. Int J Biol Sci. .

Abstract

Background: We tested the hypothesis that febuxostat (Feb) therapy effectively protected cardiorenal syndrome (CRS) rats via repressing the xanthine-oxidase (XO)-caused oxidative stress. Methods and Results: Cellular levels of apoptosis/oxidative stress/mitochondrial-membrane potential were higher in p-Cresol treated-NRK-52E cells than in control group that were reversed by Feb treatment or silencing XO gene (all P<0.001). Pilot study demonstrated that: XO activity was significantly increased in CRS than in SC group; a significant negative correlation between XO activity and left ventricular ejection fraction (LVEF) (%); a significant positive correlation between XO activity and BNP/BUN/creatinine/proteinuria levels (all P<0.01). Male-adult SD-rats were classified into groups 1(sham-control)/2 (CRS)/3 [CRS+Feb (10mg/kg/day)]/4 [CRS+Feb (30mg/kg/day)]. By day-63, the survival rate was significantly lower in group 2 than in other groups (P=0.029), and circulatory levels of FGF23/BNP/XO-activity BUN/creatinine/proteinuria and renal-artery resistance were highest in group 2/lowest in group 1/significantly lower in group 4 than in group 3, whereas the LVEF exhibited an opposite pattern of XO among the groups (all P<0.0001). Cellular levels of fibrosis/XO/H2DCFDA/CD68/CHAC1, and protein expressions of oxidative-stress (NOX-2/NOX-4/XO)/inflammatory (NF-κB/IL-1β)/fibrotic (Smad3/TFG-β)/apoptotic (CHAC1/2)/mitochondrial-damaged (p-DRP1) biomarkers in kidney/heart tissues displayed a similar pattern of XO (all P<0.0001). Conclusion: Feb therapy improved cardiorenal function and prognostic outcome in CRS rats.

Keywords: apoptosis; inflammation; mitochondrial biogenesis; oxidative stress; xanthine oxidase.


Conflict of interest statement

Competing Interests: The authors have declared that no competing interest exists.

Figures
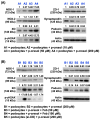
Figure 1
Figure 1
The impact of p-Cresol on oxidative stress production and podocyte damage, and the protective effect of febuxostat treatment. A) Protein expressions of NOX-1, NOX-2, OX and phosphorylated (p)-γ-H2AX were notably progressively upregulated as the concentration of p-Cresol was progressively increased (i.e., 0, 10, 50, 200 µM). On the other hand, the protein expressions of ZO-1, synaptopodin and podocin were remarkably progressively attenuated as the concentration of p-Cresol was progressively increased. B) Undergoing a fixed high dose of p-Cresol (200 µM) treatment, the protein expressions of NOX-1, NOX-2, XO and γ-H2AX were notably progressively suppressed as the concentration of Feb was increased (i.e., 0, 50, 100 µM), whereas the protein expressions of ZO-1, synaptopodin and podocin displayed an opposite manner of oxidative stress. Similarly, silencing the XO in the podocytes undergoing a fixed high dose of p-Cresol (200 µM) treatment also contributed a consistent impact as Feb treatment among the groups. n = 1 for each group; Feb = febuxostat; XO = xanthine oxidase; ZO-1 = Zonula occludens-1.
Figure 2
Figure 2
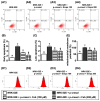
Flow cytometric analysis for assessment of impact of febuxostat treatment on cell viability and total intracellular and mitochondrial ROS undergoing p-Cresol stimulation. A) MTT assay for identification of NRK-52E cell viability at 24h, * vs. other groups with different symbols (†, ‡, §), P<0.0001. B) MTT assay for identification of NRK-52E cell viability at 48hrs, * vs. other groups with different symbols (†, ‡, §), p<0.0001. C) MTT assay for identification of NRK-52E cell viability at 72h, * vs. other groups with different symbols (†, ‡, §), P<0.0001. D) Flow cytometric analysis of mean fluorescent intensity of total intracellular ROS (i.e., by H2DCF-DA stain), * vs. other groups with different symbols (†, ‡, §), P<0.0001. E) Flow cytometric analysis of mean fluorescent intensity of mitochondrial ROS (i.e., by mitoSOX stain), * vs. other groups with different symbols (†, ‡, §), P<0.0001. All statistical analyses were performed by one-way ANOVA, followed by Bonferroni multiple comparison post hoc test (n=6 for each group). Symbols (*, †, ‡, §) indicate significance (at 0.05 level).
Figure 3
Figure 3
Flow cytometric analysis for apoptosis detection and mitochondrial membrane potential for evaluating mitochondrial function. A1 to A4) Illustrating the flow cytometric analysis for identification of early (V+/PI-) and late (V+/PI+) apoptosis. B) Analytical result of early apoptosis, * vs. other groups with different symbols (†, ‡, §), P<0.0001. C) Analytical result of late apoptosis, * vs. other groups with different symbols (†, ‡, §), P<0.0001. D1-D4) Flow cytometric analysis for identification of mitochondrial function (i.e., by MitoTracker deep red staining). E) Analytical results of mitochondrial membrane potential (MMP), * vs. other groups with different symbols (†, ‡, §), P<0.0001. All statistical analyses were performed by one-way ANOVA, followed by Bonferroni multiple comparison post hoc test (n=6 for each group). Symbols (*, †, ‡, §) indicate significance (at 0.05 level). XO = xanthine oxidase.
Figure 4
Figure 4
XO activity remarkably elevated and significantly positively correlated to heart and renal dysfunction in rat CRS model by day 42 after CRS induction. A) Illustrating the transthoracic echocardiographic imaging in SC group and CRS group, respectively. The M-mode showed that the left ventricular (LV) contractility notably reduced, whereas the chamber dilatation was notably increased in CRS animal as compared with SC, implicating LV remodeling developed in CRS animal. B) The XO activity was significantly increased in CRS than in SC group. C) Analytical result showed a significant negative correlation between XO activity and left ventricular ejection fraction (LVEF) (%). D) The circulatory level of BNP was significantly increased in CRS group than in that of SC group. E) Analytical result showed a significant positive correlation between circulatory level of BNP and XO activity. F) Circulating level of creatine level was significantly increased in CRS group than in SC group by day 42 after CRS induction. G) Circulating level of blood urea nitrogen (BUN) was significantly increased in CRS group than in SC group by day 42 after CRS induction. H) The ratio of urine protein to urine creatinine (RPu/Uc) (C) was significantly elevated in CRS group as compared to that of the SC group. I to K) Analytical results showed there were significantly positive correlations between XO activity and creatine (I), BUN (J) and the RPu/Uc (K). The statistical analyses were calculated by t-test or Pearson's correlation. ** indicating P<0.001; *** indicating P<0.0001 (n=6-12/group). SC = sham control; CRS = cardiorenal syndrome; BNP = brain natriuretic peptide; XO = xanthine oxidase.
Figure 5
Figure 5
Microscopic findings (400x) for identification of histopathological change, fibrosis, XO activity and ROS in LV myocardium and kidney parenchyma. Upper panel of histopathological findings in LV myocardium: A1 & A2) Microscopic finding (100x) of H.E. stain demonstrated the histopathological changes, including lost cardiomyocytes, inflammatory cell infiltration (gray color) and disorganized of myocardial fiber architecture were notably increased in CRS animal (A2) than in SC animal (A1). Scale bar in right lower corner represents 100µm. B1 & B2) Microscopic finding (200x) of Masson's trichrome stain showed the fibrotic area (blue color) was remarkably increased in CRS (B1) than that of SC (B2). Scale bar in right lower corner represents 50µm. C1 & C2) Microscopic finding (400x) of immunohistochemical (IHC) stain showed that the XO expression (gray color) was markedly increased in CRS (C1) than that of SC (C2). Scale bar in right lower corner represents 20µm. D1 & D2) Microscopic finding (400x) of immunofluorescent (IF) stain showed that the fluorescent intensity (i.e., H2DCFDA staining) (green color) were markedly increased in CRS (D1) than that of SC (D2). Scale bar in right lower corner represents 20µm. SC = sham control; CRS = cardiorenal syndrome; XO = xanthine oxidase. Lower panel of histopathological findings in kidney parenchyma: A3 & A4) Microscopic finding (200x) of H.E. stain demonstrated the kidney injury scores, including loss of brush border in renal tubules, tubular necrosis, tubular dilatation, and dilatation of Bowman's capsule, were notably higher in CRS (A3) than in SC (A4). Scale bar in right lower corner represents 50µm. B3 & B4) Microscopic finding (200x) of Masson's trichrome stain showed the fibrotic area (blue color) were remarkably increased in CRS (B3) than that of SC (B4). Scale bar in right lower corner represents 50µm. C3 & C4) Microscopic finding (400x) of IHC stain showed that the XO expression (gray color), predominantly localized in renal tubules (green arrows), was markedly increased in CRS (C3) than that of SC (C4). Scale bar in right lower corner represents 20µm. D3 & D4) Microscopic finding (400x) of IF microscope showed that the fluorescent intensity (i.e., H2DCFDA staining) (green color) was markedly increased in CRS than that of SC. Scale bar in right lower corner represents 20µm. SC = sham control; CRS = cardiorenal syndrome; XO = xanthine oxidase; LV = left ventricular.
Figure 6
Figure 6
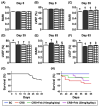
The time courses of circulatory BUN and creatinine levels and RUp/Uc, and circulating levels of FGF23, BNP and XO activity by day 63 after CRS induction. A) Circulatory level of blood urea nitrogen (BUN) by day 0, P>0.5. B) Circulatory level of creatinine by day 0, P>0.5. C) The ratio of urine protein to urine creatinine (RUp/Uc) by day 0, P>0.5. D) Circulatory level of BUN by day 35, * vs. †, P<0.0001. E) Circulating level of creatinine, * vs. †, P<0.0001. F) The RUp/Uc by day 35, * vs. †, P<0.0001. G) Circulatory level of BUN by day 60, * vs. other groups with different symbols (†, ‡), P<0.0001. H) Circulatory level of creatinine by day 60, * vs. other groups with different symbols (†, ‡), P<0.0001. I) The RUp/Uc by day 60, * vs. other groups with different symbols (†, ‡, §), P<0.0001. J) circulating level of fibroblast growth factor 23 (FGF23) by day 60, * vs. other groups with different symbols (†, ‡, §), P<0.0001. K) Circulatory level of brain natriuretic peptide (BNP) by day 60, * vs. other groups with different symbols (†, ‡, §), P<0.0001. L) Circulatory level of xanthine oxidase by day 60, * vs. other groups with different symbols (†, ‡, §), P<0.0001. All statistical analyses were performed by one-way ANOVA, followed by Bonferroni multiple comparison post hoc test (n=6-8) for each group). Symbols (*, †, ‡, §) indicate significance (at 0.05 level). Feb = febuxostat; CRS = cardiorenal syndrome.
Figure 7
Figure 7
Serial changes of LVEF and RARI, and mortality rate by day 63 after CRS induction. A) Analytical result of renal artery restrictive index RARI at day 0, p>0.5. B) Analytical result of LVEF at day 0, P>0.5. C) Analytical result of RARI by day 35, * vs. †, P<0.0001. D) Analytical result of LVEF by day 35, * vs. †, P<0.0001. E) Analytical result of RARI by day 60, * vs. other groups with different symbols (†, ‡, §), P<0.0001. F) Analytical result of LVEF by day 60, * vs. other groups with different symbols (†, ‡), P<0.0001. G) Showing the survival rate (i.e., 77.1%) within the day 35 after CRS induction prior to grouping. H) Showing the accumulated survival rate from days 36 to 63 after CRS induction among the groups, * vs. *, P=0.029. All statistical analyses were performed by one-way ANOVA, followed by Bonferroni multiple comparison post hoc test (n=9-21) for each group). Symbols (*, †, ‡, §) indicate significance (at 0.05 level). Feb = febuxostat; CRS = cardiorenal syndrome. LVEF = left ventricular ejection fraction; RARI = renal artery resistive index.
Figure 8
Figure 8
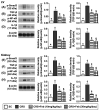
Impact of Feb therapy on regulating mitochondrial biogenesis signalings, oxidative stress and antioxidants in LV myocardium (Upper panel) and kidney (Lower panel) tissues by day 63 after CRS induction. Left panel (LV myocardium) and Right panel (kidney): A) Protein expression of phosphorylated (p)-AMPK, * vs. other groups with different symbols (†, ‡, §), P<0.0001. B) Protein expression of SIRT1, * vs. other groups with different symbols (†, ‡, §), P<0.0001. C) Protein expression of xanthine oxidase (XO), * vs. other groups with different symbols (†, ‡, §), P<0.0001. D) Protein expression of PGC-1α, * vs. other groups with different symbols (†, ‡, §), P<0.0001. E) Protein expression of SOD1, * vs. other groups with different symbols (†, ‡, §), P<0.0001. F) Protein expression of p-DRP1, * vs. other groups with different symbols (†, ‡, §), P<0.0001. G) Protein expression of NOX-4, * vs. other groups with different symbols (†, ‡, §), P<0.0001. H) Protein expression of NOX-2, * vs. other groups with different symbols (†, ‡, §), P<0.0001. I) Protein expression of catalase, * vs. other groups with different symbols (†, ‡, §), P<0.0001. J) Protein expression of ChaC glutathione specific gamma-glutamylcyclotransferase 1 (CHAC1), * vs. other groups with different symbols (†, ‡, §), P<0.0001. K) Protein expression of CHAC2, * vs. other groups with different symbols (†, ‡, §), P<0.0001. All statistical analyses were performed by one-way ANOVA, followed by Bonferroni multiple comparison post hoc test (n=6) for each group). Symbols (*, †, ‡, §) indicate significance (at 0.05 level). Feb = febuxostat; CRS = cardiorenal syndrome; LV = left ventricular.
Figure 9
Figure 9
Impact of Feb therapy on downregulating the fibrosis and inflammation in LV myocardium and kidney by day 63 after CRS induction. Upper panel (LV myocardium): A) Protein expression of p-Smad3, * vs. other groups with different symbols (†, ‡, §), P<0.0001. B) Protein expression of TGF-β, * vs. other groups with different symbols (†, ‡, §), P<0.0001. C) Protein expression of phosphorylated (p)-nuclear factor (NF)-κB, * vs. other groups with different symbols (†, ‡, §), P<0.0001. D) Protein expression of interleukin (IL)-1β, * vs. other groups with different symbols (†, ‡, §), P<0.0001. Lower panel (kidney): E) Protein expression of p-Smad3, * vs. other groups with different symbols (†, ‡, §), P<0.0001. F) Protein expression of TGF-β, * vs. other groups with different symbols (†, ‡, §), P<0.0001. G) Protein expression of p-NF-κB, * vs. other groups with different symbols (†, ‡, §), P<0.0001. H) Protein expression of interleukin (IL)-1β, * vs. other groups with different symbols (†, ‡, §), P<0.0001. All statistical analyses were performed by one-way ANOVA, followed by Bonferroni multiple comparison post hoc test (n=6) for each group). Symbols (*, †, ‡, §) indicate significance (at 0.05 level). Feb = febuxostat; CRS = cardiorenal syndrome; LV = left ventricular.
Figure 10
Figure 10
Cellular expressions of fibrosis in LV myocardium and kidney by day 63 after CRS induction. A to D) Illustrating the microscopic finding (200x) of Masson's trichrome stain for identification of fibrotic area in LV myocardium (blue color). E) Analytical result of fibrotic area, * vs. other groups with different symbols (†, ‡, §), P<0.0001. F to I) Illustrating the microscopic finding (200x) of Masson's trichrome stain for identification of fibrotic area in kidney parenchyma (blue color). J) Analytical result of fibrotic area, * vs. other groups with different symbols (†, ‡, §), P<0.0001. Scale bar in right lower corner represents 50µm. All statistical analyses were performed by one-way ANOVA, followed by Bonferroni multiple comparison post hoc test (n=6) for each group). Symbols (*, †, ‡, §) indicate significance (at 0.05 level). Feb = febuxostat; CRS = cardiorenal syndrome; LV = left ventricular.
Figure 11
Figure 11
Cellular expressions of reactive oxygen species (ROS) and xanthine oxidase (XO) in LV myocardium and kidney by day 63 after CRS induction. Upper panel: A to D) Immunofluorescent (IF) microscopic finding (200x) for identification of cellular expression of ROS in LV myocardium (green color). E) Analytical result of mean fluorescent intensity (i.e., by H2DCFDA stain), * vs. other groups with different symbols (†, ‡, §), P<0.0001. F to I) The IF microscopic finding (200x) for identification of cellular expression of ROS in kidney parenchyma (green color). J) Analytical result of mean fluorescent intensity (i.e., by H2DCFDA stain), * vs. other groups with different symbols (†, ‡, §), P<0.0001. Scale bar in right lower corner represents 50µm. Lower panel: A to D) Illustrating the microscopic finding (400x) of immunohistochemical (IHC) stain for identification of cellular expression of XO in LV myocardium (gray color). E) Analytical result of XO expression score, * vs. other groups with different symbols (†, ‡, §), P<0.0001. F to I) Illustrating the microscopic finding (400x) of IHC stain for identification of cellular expression of XO in kidney parenchyma (gray color). J) Analytical result of XO expression score, * vs. other groups with different symbols (†, ‡, §), P<0.0001. Scale bar in right lower corner represents 20µm. All statistical analyses were performed by one-way ANOVA, followed by Bonferroni multiple comparison post hoc test (n=6) for each group). Symbols (*, †, ‡, §) indicate significance (at 0.05 level). Feb = febuxostat; CRS = cardiorenal syndrome; LV = left ventricular.
Figure 12
Figure 12
Cellular expressions of inflammation and CHAC1 in LV myocardium and kidney by day 63 after CRS induction. Upper panel: A to D) Illustrating the microscopic finding (400x) of immunofluorescent (IF) stain for identification of cellular expression of CD68 in LV myocardium (green color). E) Analytical result of number of CD68 expression (%), * vs. other groups with different symbols (†, ‡, §), P<0.0001. F to I) Illustrating the microscopic finding (400x) of IF stain for identification of cellular expression of CD68 in kidney parenchyma (green color). J) Analytical result of number of CD68 expression (%), * vs. other groups with different symbols (†, ‡, §), P<0.0001. Lower panel: A to D) Illustrating the microscopic finding (400x) of immunohistochemical (IHC) stain for identification of cellular expression of CHAC1 in LV myocardium (gray color). E) Analytical result of CHAC1 expression (%), * vs. other groups with different symbols (†, ‡, §), P<0.0001. F to I) Illustrating the microscopic finding (400x) of IHC stain for identification of cellular expression of CHAC1 in kidney parenchyma (gray color). J) Analytical result of CHAC1 expression score, * vs. other groups with different symbols (†, ‡, §), P<0.0001. Scale bar in right lower corner represents 20µm. All statistical analyses were performed by one-way ANOVA, followed by Bonferroni multiple comparison post hoc test (n=6) for each group). Symbols (*, †, ‡, §) indicate significance (at 0.05 level). Feb = febuxostat; CRS = cardiorenal syndrome; LV = left ventricular.
Figure 13
Figure 13
Illustrasting the underlying mechanims of XO indcued cardiorenal syndrome and the impact of Feb treatment on protecting the heart and kidney organs in setting of CRS. NO = nitric oxide; CRS = cardiorenal syndrome; LVEF = left ventricular ejection fraction; ROS = reactive oxygen species; Feb = Febuxostat.

References

    1. Ronco C, Haapio M, House AA, Anavekar N, Bellomo R. Cardiorenal syndrome. J Am Coll Cardiol. 2008;52:1527–39. - PubMed
    1. Gnanaraj J, Radhakrishnan J. Cardio-renal syndrome. F1000Res. 2016. 5. - PMC - PubMed
    1. Hadjiphilippou S, Kon SP. Cardiorenal syndrome: review of our current understanding. J R Soc Med. 2016;109:12–7. - PMC - PubMed
    1. Ronco C, Bellasi A, Di Lullo L. Cardiorenal Syndrome: An Overview. Adv Chronic Kidney Dis. 2018;25:382–90. - PubMed
    1. Zannad F, Rossignol P. Cardiorenal Syndrome Revisited. Circulation. 2018;138:929–44. - PubMed

LinkOut - more resources