. 2025 Feb 3;21(4):1705-1729.
doi: 10.7150/ijbs.101598. eCollection 2025.

Prolonged DEHP exposure enhances the stemness and metastatic potential of TNBC cells in an MSI2-dependent manner

Affiliations

Prolonged DEHP exposure enhances the stemness and metastatic potential of TNBC cells in an MSI2-dependent manner

Mahendra Jadhao et al. Int J Biol Sci. .

Abstract

Di(2-ethylhexyl) phthalate (DEHP) is a commonly used plasticizer, and human exposure to phthalates is a major health concern. DEHP, which is widely recognized as an endocrine disruptor, is associated with an increased risk of several diseases, including breast cancer. Triple-negative breast cancer (TNBC) is an aggressive subtype of breast cancer, and metastasis is the leading cause of TNBC-related mortality. However, the correlation between DEHP exposure and TNBC metastasis remains elusive. In the present study, we found that prolonged DEHP treatment enhanced the migration and invasion of TNBC cells both in vitro and in vivo. Mechanistically, DEHP exposure induced Musashi RNA binding protein 2 (MSI2) overexpression, which subsequently activated the PI3K/Akt/NF-κB/MMP-9 axis to augment metastatic potential. MSI2 also promoted stemness. Interestingly, we identified a novel function of MSI2 in regulating the expression, distribution, and polarization of vimentin that is independent of its conventional RNA binding and translation regulation. Genetic knockdown of MSI2 potently abolished DEHP-mediated TNBC progression. Moreover, MSI2 depletion inhibited lung metastasis in metastatic mouse models but did not affect proliferation or tumor size. Intriguingly, miR-155-5p downregulation was observed after DEHP exposure, while mimic miR-155-5p treatment inhibited DEHP-induced TNBC migration, accompanied by reduced expression of MSI2 and vimentin. These findings suggested an inverse relationship between miR-155-5p levels and MSI2 expression. Taken together, MSI2 might serve as a potential therapeutic target and function as a prognostic biomarker for TNBC patients.

Keywords: Di-2-ethylhexyl phthalate (DEHP); Metastasis; Musashi RNA binding protein 2 (MSI2); Stemness; Triple-negative breast cancer (TNBC); miR-155-5p.


Conflict of interest statement

Competing Interests: The authors have declared that no competing interest exists.

Figures

Figure 1
Figure 1
Prolonged DEHP exposure enhanced the migration and invasion of MDA-MB-231 cells both in vitro and in vivo. (A) Cell migration of untreated and DEHP-exposed MDA-MB-231 cells evaluated by a wound healing assay for 20 h. (B) Quantitative analysis of cell migration (means ± SD). (C) Cell invasion of untreated and DEHP-exposed MDA-MB-231 cells were assessed with Matrigel-coated Transwell inserts for 24 h. (D) Quantitative analysis of cell invasion (means ± SD). (E-F) Cell proliferation evaluated by the MTT assay at 24 h and 48 h. (G) Zebrafish xenograft assay to confirm in vivo cell migration in Tg (fli1:EGFP) zebrafish embryos (fluorescence images obtained at 24 hpi). (H) Quantification of the percentage of zebrafish embryos showing cell migration to SIV (means ± SD, n=50). (I) Quantitative analysis of cell migration to the zebrafish SIV (fluorescence intensity indicative of cell number, fold change vs control); ** P < 0.001.
Figure 2
Figure 2
Involvement of MSI2 in DEHP-induced migration and invasion as predicted by NGS analysis. (A) Heatmap of DEGs in control and DEHP-exposed cells. (B) Venn diagram of total DEGs overlapping among different samples; volcano plot of the DEGs; pie chart of common differentially expressed GO terms in control and DEHP-exposed clones #1 and #2. (C) Bar chart of significantly enriched GO terms and the number of DEGs enriched in biological processes (green) and cellular components (orange); (* significant enrichment). (D) IPA-derived heatmap analysis of cellular movement under various conditions and the functions of the DEGs involved. (E) Downstream analysis of genes involved in the migration and invasion of tumor cell lines, highlighting increased MSI2 expression.
Figure 3
Figure 3
MSI2 knockdown reversed DEHP-induced migration and invasion in vitro and in vivo. (A) Cell morphology of Scr-treated and MSI2-silenced MDA-MB-231 and DEHP-exposed clones as observed by light microscopy. Scale bar = 150 µm. (B) Quantitative analysis of cell length (means ±SDs). (C) A wound healing assay was performed to validate the role of MSI2 in DEHP-induced migration in Scr- and MSI2-silenced MDA-MB-231 cells and in DEHP-exposed clones. (D) Quantitative analysis of cell migration at 20 h after wound formation (mean ± SD). (E-F) Matrigel-coated Transwell assay to evaluate the effect of MSI2 knockdown on cell invasion and quantitative analysis of cell invasion for (E) 12h and (F) 24h. (G) Zebrafish xenograft assay to evaluate the cell migration of Scr-treated and MSI2-silenced MDA-MB-231- and DEHP-exposed clones in 48 hpf Tg (fli1:EGFP) zebrafish embryos (fluorescence image captured at 24 hpi). (H-I) Quantification of embryos showing metastasis to SIV (mean ±SD, n=50) and fluorescence intensity analysis of cells that migrated to SIV in zebrafish embryos (fluorescence intensity reflects the cell number, fold change vs. control); ** P < 0.001.
Figure 4
Figure 4
Prolonged DEHP exposure induces EMT and stemness in MDA-MB-231 cells in an MSI2-dependent manner. (A) Changes in the expression of the EMT markers α-SMA, β-catenin, SNAI1, and vimentin, as evaluated by western blotting. (B) Evaluation of the effect of MSI2 knockdown on the expression of EMT markers by western blotting. (C) Anchorage-independent growth/spheroid formation as evaluated by the soft agar colony formation assay. Scale bar = 50 µm. (D-E) Quantitative analysis of the number and size of colonies/spheroids originating from untreated and DEHP-exposed MDA-MB-231 cells. (F) Assessment of anchorage-independent growth/spheroid formation by soft agar colony formation assays in Scr-treated and MSI2-depleted cells. Scale bar = 50 µm. (G-H) Quantitative analysis of colony number and colony size in the soft agar colony formation assay (mean ± SD). (I) Changes in the expression of the stemness-related markers CD133, cMyc, and SOX-2 in untreated and DEHP-exposed clones evaluated by western blotting. (J) Evaluation of changes in the expression of stemness-related markers in Scr-treated and MSI2-depleted MDA-MB-231 cells and in DEHP-exposed clones; **P < 0.001.
Figure 5
Figure 5
MSI2 regulates the PI3K/Akt/NFκB signaling axis. (A) Heatmap of DEGs from the co-IP protein complexes in control and DEHP-exposed cells. (B) Volcano plot of total DEGs in control and DEHP-exposed cells (red: upregulated; green: downregulated). (C) KEGG pathway analysis identified the 5 most significantly enriched pathways with DEG annotations, p values, and q values. (D-E) GSEA of TNFα and Akt signaling revealed a positive correlation in untreated MDA-MB-231 cells and DEHP-exposed clone #1 cells (enrichment score). (F) Evaluation of the expression of the PI3K/Akt/NFκB signaling markers PI3K p85, p-PI3K, Akt, p-Akt, Ikkα, Ikkβ, Ikkε, p-Ikkα/β, and NFκB in untreated MDA-MB-231 cells and DEHP-exposed clones.
Figure 6
Figure 6
NFκB controls DEHP-induced cell migration via MMP-9 regulation. (A) Total and nuclear NFκB p65 expression levels in Scr-treated and MSI2-depleted MDA-MB-231 and DEHP-exposed clones were evaluated by western blotting. (B) Gelatin zymography analysis of MMP-9 expression in Scr-treated and MSI2-depleted MDA-MB-231 cells and DEHP-exposed clones. (C) IF analysis of intracellular NFκB p65 (red) localization and expression. Nuclear staining (blue). Scale bar = 100 µm. (D-E) Evaluation of total and nuclear NFκB p65 expression levels following BAY 11--7082 treatment (10 µM, 24 h) by western blotting in MDA-MB-231 and DEHP-exposed clones. (F) MMP-9 expression/activity analysis by gelatin zymography in BAY 11-7082 (10 µM, 24 h)-treated MDA-MB-231 cells and DEHP-exposed clones. (G) IF analysis of intracellular NFκB p65 (red) localization and expression following BAY 11--7082 (10 µM, 24 h) treatment. Nuclear staining (blue). Scale bar = 100 µm. (H) Effect of BAY 11-7082 (10 µM, 24 h) treatment on cell migration as evaluated by a wound healing assay for 24 h. (I) Quantitative analysis of cell migration at 24 h after wound formation (mean ± SD); **P < 0.001.
Figure 7
Figure 7
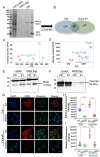
MSI2 interacts with vimentin and regulates its expression and subcellular distribution. (A) SDS-PAGE analysis of total cell lysates, Flag-MSI2 co-IP eluates, and antibodies (IgG). (B) LC/MS/MS analysis and protein identification evaluation (unique and shared proteins) of Flag-MSI2 co-IP protein complexes in untreated MDA-MB-231 and DEHP-exposed clone #1 cells performed by Proteome Discoverer software. (C) Unique peptide identification of LC/MS/MS vimentin (FANYIDK) and (D) MSI2 (IFVGGLSANTVVEDVKQYFEQFGK). x-axis: mass/charge ratio (m/z), y-axis: intensity of peak [count]. (E-F) Evaluation of MSI2 and vimentin coexpression in cell lysates and co-IP products by western blotting. (G) IF analysis of the intracellular localization and expression of MSI2 (red) and vimentin (green). Nuclear staining (blue). Scale bar = 50 µm. (H-I) Quantitative analysis of MSI2 (H) and vimentin (I) expression in Scr-treated and MSI2-depleted MDA-MB-231 cells and DEHP-exposed clone #1 cells (means ± SDs); **P < 0.001.
Figure 8
Figure 8
miR-155-5p negatively regulates MSI2 expression and MSI2-induced migration. (A) Evaluation of prediction-based MSI2-targeting miRNAs via the TargetScanHuman (Release 7.2) and miRBD miRNA target prediction databases. Conserved sites, site length and predicted position of the miR-155-5p binding site in the MSI2 3′UTR. (B) Evaluation of miR-155-5p levels by qPCR in untreated MDA-MB-231 cells and DEHP-exposed clones. (C) Effects of miR-155-5p mimic treatment (10, 25, or 50 nM) on cell migration, as evaluated by a wound healing assay 20 h after scratching. (D) Quantitative analysis of cell migration at 20 h after wound formation (means ± SDsSDs). (E) Evaluation of changes in the expression of MSI2 and vimentin in miR-155-5p mimic-treated (10, 25, 50 nMol) DEHP-exposed clones. (F-G) Evaluation of the effect of the miR-155-5p mimic on MSI2 (F) and vimentin (G) mRNA levels in DEHP-exposed clone #1 cells (means ± SDsSD). (H) Evaluation of miR-155-5p specificity with respect to the MSI2 3′UTR via a luciferase reporter assay via MSI2 3′UTR luciferase expression clone transfection in 293T cells (mean ±SD); **P < 0.001.
Figure 9
Figure 9
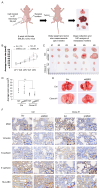
MSI2 knockdown reduces DEHP-induced breast cancer metastasis in vivo. (A) The effect of prolonged DEHP treatment on TNBC cell metastasis was evaluated in a mouse metastasis model. Untreated and DEHP-exposed MDA-MB-231 cells (Scr and MSI2 knockdown) were implanted into the mammary fat pads of 8-week-old female BALB/c nude mice. The average tumor size was recorded. The mice were sacrificed and processed for evaluation of metastasis. (B) Evaluation of average tumor sizes in different groups (mean ±SD). (C-D) Evaluation of tumor growth and size measurements of excised tumors (means ± SDs). (E) Evaluation of lung metastasis by morphological changes and changes in the size of the excised lungs. (F) Lung metastasis evaluation via IHC analysis of the metastasis-associated markers vimentin, N-cadherin, E-cadherin, and HLA-ABC. Scale bar = 30 µm. *P < 0.05, **P < 0.001.
Figure 10
Figure 10
Schematic representation of DEHP-induced TNBC progression. Low-dose and prolonged DEHP exposure results in MSI2 overexpression in MDA-MB-231 cells. Increased MSI2 expression initiates the PI3K/Akt/NF-κB/MMP-9 axis and regulates vimentin to enhance EMT, which facilitates migration, invasion, and metastasis. In addition, MSI2 promotes TNBC stemness. Interestingly, miR-155-5p negatively regulates the expression of MSI2, while miRNA-155-5p is downregulated under DEHP treatment.

References

    1. Api AM. Toxicological profile of diethyl phthalate: a vehicle for fragrance and cosmetic ingredients. Food Chem Toxicol. 2001;39:97–108. - PubMed
    1. Lin H, Yuan K, Li L, Liu S, Li S, Hu G. et al. In Utero Exposure to Diethylhexyl Phthalate Affects Rat Brain Development: A Behavioral and Genomic Approach. Int J Environ Res Public Health. 2015;12:13696–710. - PMC - PubMed
    1. Li PC, Li XN, Du ZH, Wang H, Yu ZR, Li JL. Di (2-ethyl hexyl) phthalate (DEHP)-induced kidney injury in quail (Coturnix japonica) via inhibiting HSF1/HSF3-dependent heat shock response. Chemosphere. 2018;209:981–8. - PubMed
    1. Kaur J, Mania I. Deep transcranial magnetic stimulation (dTMS) for treatment of major depressive disorder (MDD) status post-surgical removal of medulloblastoma: A case report of safety. Brain Stimul. 2019;12:1061–2. - PubMed
    1. Khasin LG, Della Rosa J, Petersen N, Moeller J, Kriegsfeld LJ, Lishko PV. The Impact of Di-2-Ethylhexyl Phthalate on Sperm Fertility. Front Cell Dev Biol. 2020;8:426. - PMC - PubMed

MeSH terms

LinkOut - more resources