

Identification of mesenchymal stem cell populations with high osteogenic potential using difference in cell division rate
- PMID: 39991510
- PMCID: PMC11846930
- DOI: 10.1016/j.reth.2025.01.020
Identification of mesenchymal stem cell populations with high osteogenic potential using difference in cell division rate
Abstract
Introduction: In bone regenerative medicine, mesenchymal stem cells (MSCs) have been widely investigated for their potential in bone regeneration. However, MSCs are a heterogeneous cell population containing a variety of cell types, making it difficult to obtain a homogeneous MSC population sufficient for tissue regeneration. Our group previously reported that by selecting rapidly dividing human auricular chondrocytes, it was possible to enrich for more chondrogenic cells. In this study, we aimed to identify a highly osteogenic MSC population by using a similar approach for mouse bone marrow MSCs.
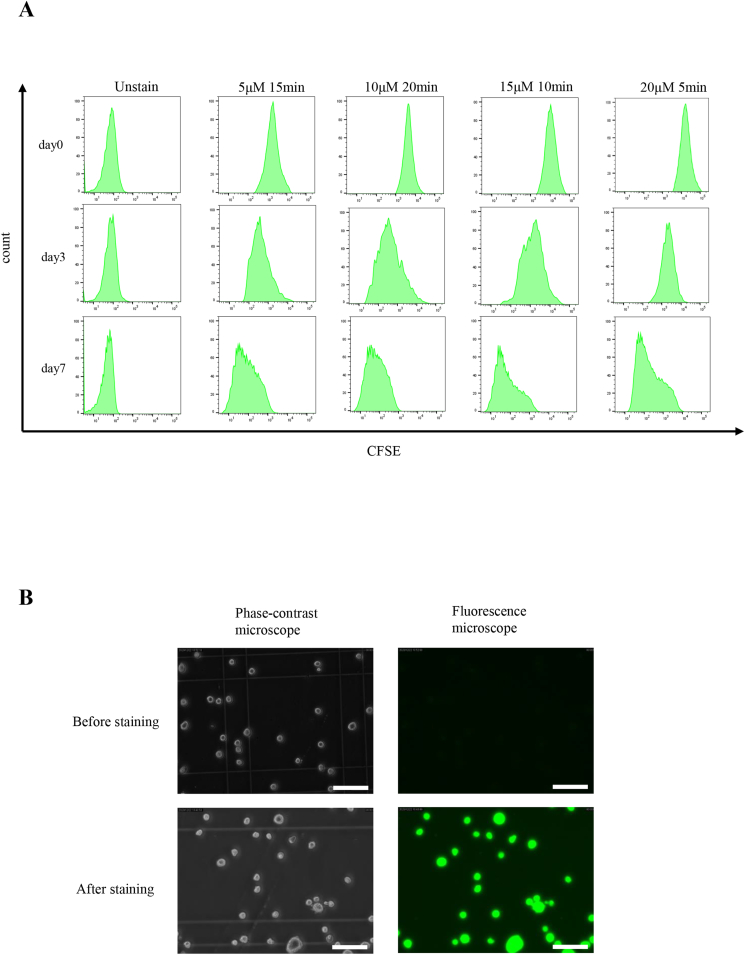
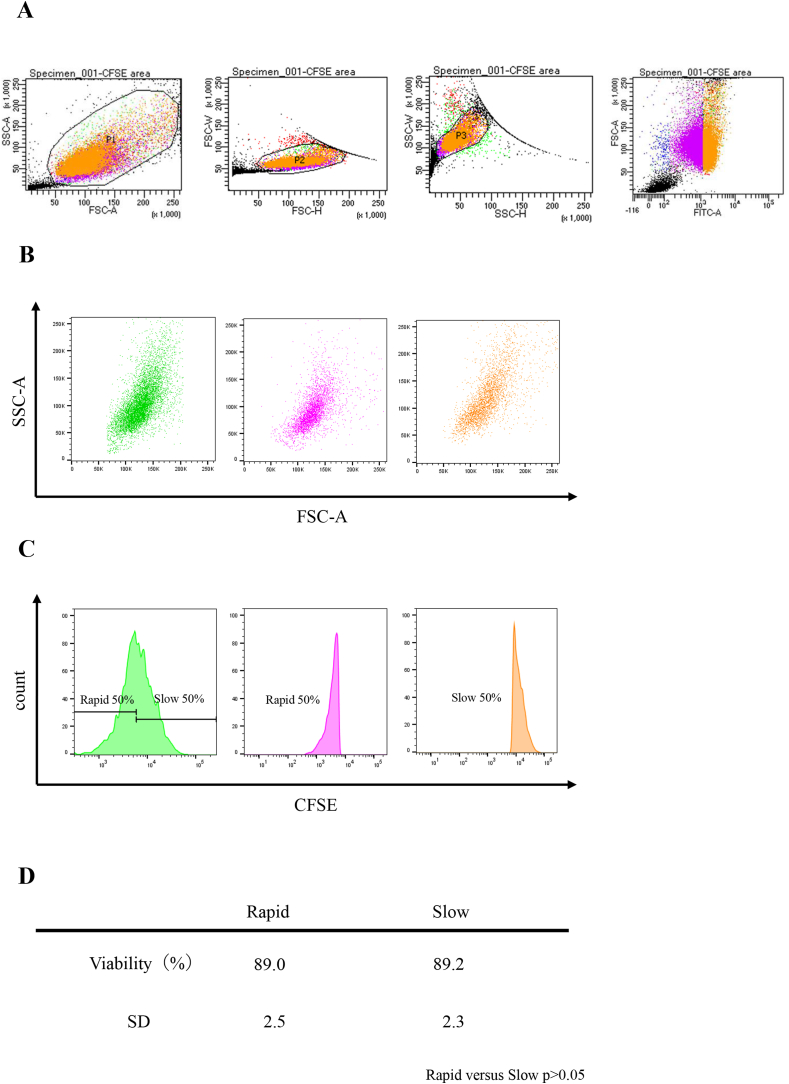
Methods: Mouse bone marrow MSCs were fluorescently labeled with carboxyfluorescein succinimidyl ester (CFSE) and sorted according to the fluorescence intensity using flow cytometry on day 3 after labeling. To compare the ability to produce bone matrix in vitro, osteogenic differentiation cultures were performed and mineral deposition was confirmed by alizarin red staining. Real-time qPCR was also performed to examine the differences in gene expression between the fast- and slow-dividing cell groups immediately after aliquoting and after osteogenic differentiation.
Results: Differences in the growth rate of the fractionated cells were maintained after culture. Results of osteogenic differentiation culture and alizarin red staining showed more extensive mineral deposition in the slow cell group than in the fast cell group. Calcium quantification also showed higher absorbance in the slow cell group compared to the fast cell group, indicating higher osteogenic differentiation potential in the slow cell group. Furthermore, real-time qPCR analysis showed that osteocalcin expression was higher in the slow cell group in cells immediately after preparative differentiation. In addition, the expression of osteocalcin and sclerostin were higher in the slow cells after osteogenic differentiation.
Conclusion: The slow cell population contains many highly differentiated cells that are already more deeply committed to the bone lineage, suggesting that they have higher osteogenic differentiation potential than the fast cell population. This study will contribute to the realization of better bone regenerative medicine by utilizing the high osteogenic differentiation potential of the slow cell population.
Keywords: Cell division rate; Flow cytometry; Mesenchymal stem cells; Osteogenic differentiation; Regenerative medicine.
© 2025 The Author(s).
Conflict of interest statement
The authors declare the following financial interests/personal relationships which may be considered as potential competing interests: Atsuhiko Hikita was affiliated with an endowed chair supported by FUJISOFT INCORPORATED (until October 31, 2020), and is affiliated with an endowed chair supported by CPC corporation, Kyowa Co., Ltd., Kanto Chemical Co. Inc., and Nichirei corporation (July 1, 2021). Yukiyo Asawa is affiliated with an endowed chair supported by SheepMedical Co., Ltd.
Figures


References
-
- Friedenstein A.J., Gorskaja J.F., Kulagina N.N. Fibroblast precursors in normal and irradiated mouse hematopoietic organs. Exp Hematol. 1976 Sep;4(5):267–274. pmid: 976387. - PubMed
-
- Gao Yuchen, Ying Chi, Chen Yunfei, Wang Wentian, Huiyuan Li, Zheng Wenting, et al. Multi-omics analysis of human mesenchymal stem cells shows cell aging that alters immunomodulatory activity through the downregulation of PD-L1. Nat Commun. 2023 Jul 20;14(1):4373. doi: 10.1038/s41467-023-39958-5. - DOI - PMC - PubMed
LinkOut - more resources
Full Text Sources
