. 2025 Mar;603(6):1399-1415.
doi: 10.1113/JP286428. Epub 2025 Feb 24.

Modulation of cardiomyocyte contractility and action potentials with chemogenetic chloride currents

Affiliations

Modulation of cardiomyocyte contractility and action potentials with chemogenetic chloride currents

Muhammed Sönmez et al. J Physiol. 2025 Mar.

Abstract

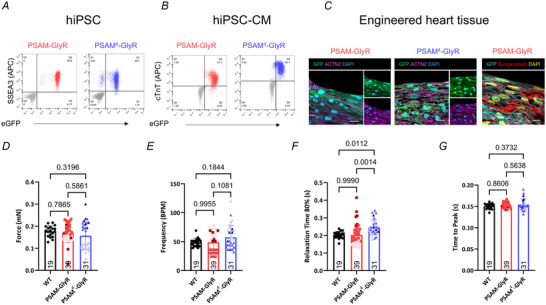
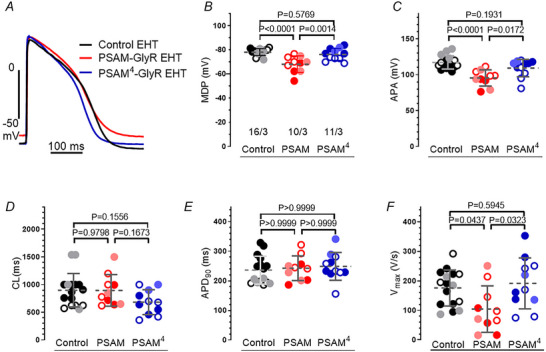
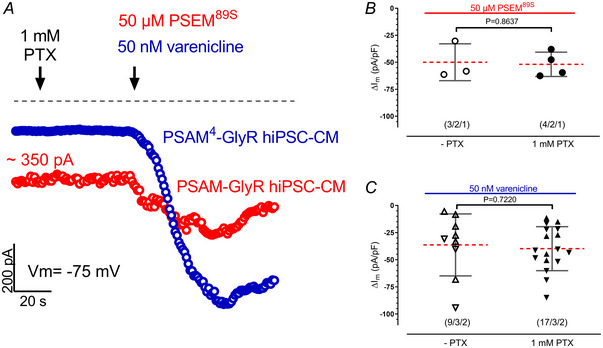
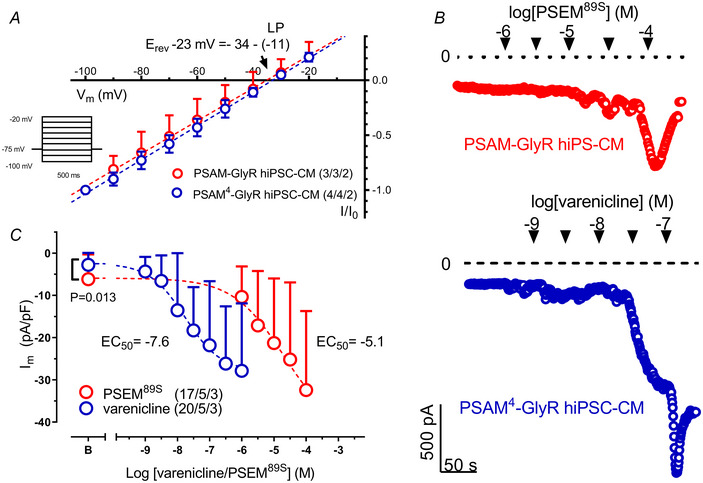
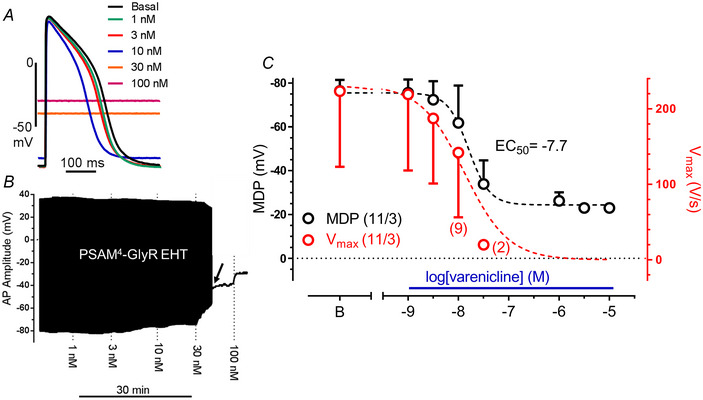
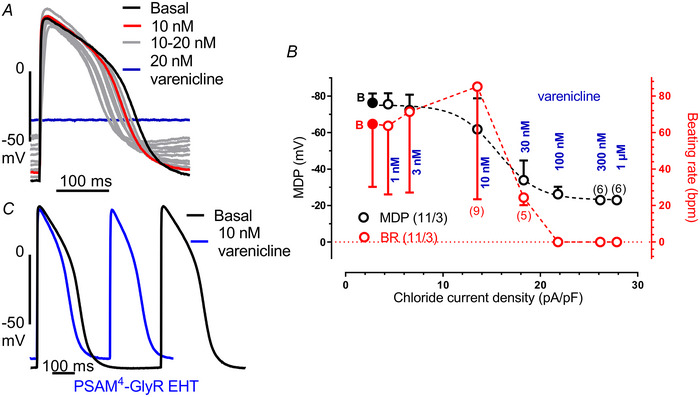
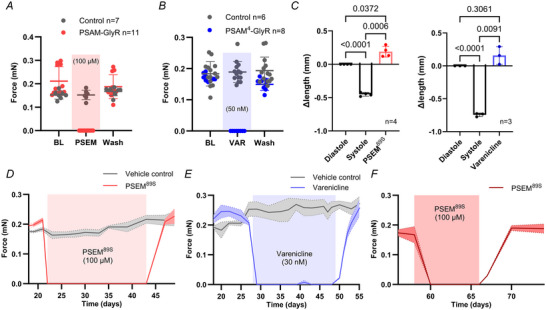
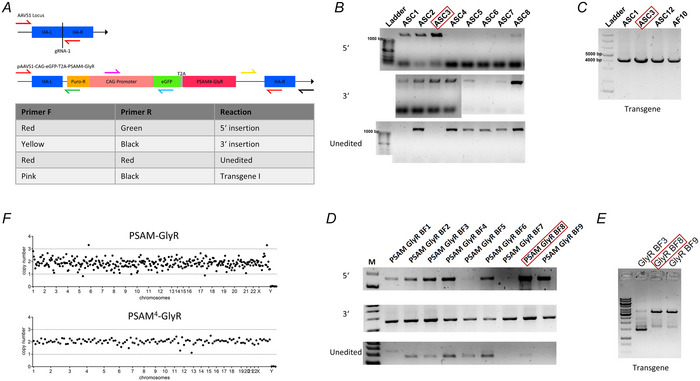
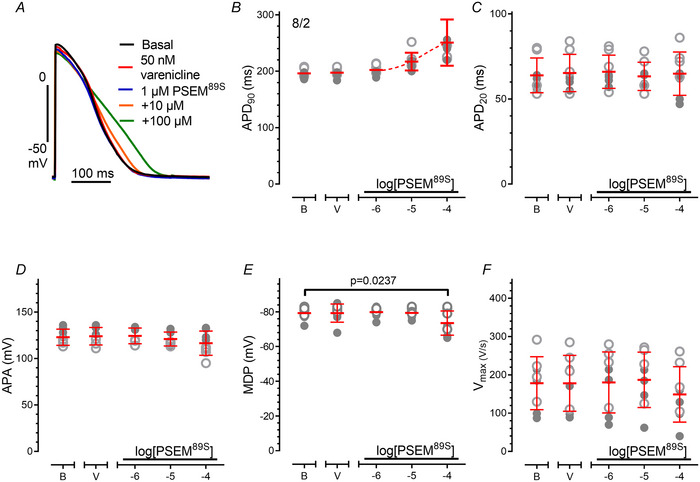
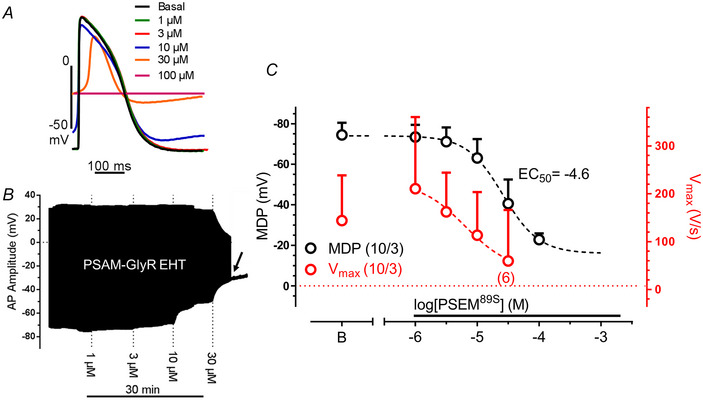
Transient perturbation of electrical activity is used in neuroscience to study the impact of specific neuronal cell populations on brain function. Similarly, cardiomyocyte (CM) physiology can be controlled by the activation of artificially expressed ion channels. Pharmacologically selective actuator modules (PSAMs) are engineered ligand-gated ion channels that can be activated with small molecules. We aimed to use the 'inhibitory' PSAMs, (i) PSAML141F,Y115F-GlyR (PSAM-GlyR) and (ii) PSAML131G,Q139L,Y217F (ultrapotent PSAM4-GlyR), which consist of modified α7-nicotinergic acetylcholine receptor ligand binding domains and the ion pore domain of the glycine receptor, to modulate CM physiology with chloride currents. We employed CRISPR/Cas9 to integrate PSAM-GlyR and PSAM4-GlyR in induced pluripotent stem cells, differentiated CMs and generated engineered heart tissue (EHT). Video optical force recordings, sharp microelectrode action potential measurements and patch-clamp technique were used to characterize PSAM-GlyR and PSAM4-GlyR CMs. PSAM-GlyR and PSAM4-GlyR activation allowed titration of chloride currents in a reversible manner. We found that chloride currents modulated action potential characteristics. Patch clamp recordings showed that channel activation resulted in chloride-driven currents that depolarized the cell. In EHT, this resulted in a stop of contractility that was fully reversible after wash-out. We provide a comprehensive characterization of the chemogenetic tools PSAM-GlyR and PSAM4-GlyR in CMs, demonstrating their utility to modulate CM activity in vitro (PSAM-GlyR and PSAM4-GlyR) but also potential for in vivo applications (PSAM4-GlyR). KEY POINTS: Pharmacologically selective actuator modules (PSAMs) are engineered ligand-gated ion channels that can be activated with small molecules. These chemogenetic tools have been applied in neuroscience to inhibit neuronal activity. Chemogenetic tools can also be used to modulate cardiomyocyte physiology. Activation of the PSAMs, PSAM-GlyR and PSAM4-GlyR depolarized cardiomyocytes and thus stopped cardiac contractility. Our study characterizes novel tools that can be used to modulate cardiomyocyte physiology in vitro and in vivo.

Keywords: cardiac electrophysiology; cardiac function; cardiomyocyte; chemogenetics; pluripotent stem cells.


Conflict of interest statement

The authors have no competing interests.

Figures

Figure 1
Figure 1. Baseline characterization of PSAM‐GlyR and PSAM4‐GlyR hiPSC and hiPSC‐cardiomyocytes
A and B, flow cytometry of either PSAM‐GlyR or PSAM4‐GlyR human induced pluripotent stem cells (hiPSCs; A) or hiPSC‐CMs (B) stained for SSEA3 or cardiac troponin T. C, longitudinal sections of a PSAM‐GlyR and PSAM4‐GlyR EHT stained for GFP and ACTN2. α‐Bungarotoxin was used to label PSAM‐GlyR. D–G, video‐optical contractility measurement of control, PSAM‐GlyR or PSAM‐GlyR4 EHT (n = 19/39/31 EHTs from n = 1/3/3 batches). D, contractile force at day 28 of culture. E, beating frequency at day 28 of culture. F, relaxation time at day 28 of culture. G, contraction time at day 28 of culture. Groups were compared using one‐way ANOVA with multiple comparison, and P‐values are provided in the graph. Measurements were performed in culture medium. Plotted are means ± SD. [Colour figure can be viewed at wileyonlinelibrary.com]
Figure 2
Figure 2. PSAM‐GlyR EHT but not PSAM4‐GlyR EHT had a less negative maximum diastolic potential
A, action potential traces recorded in control, PSAM‐GlyR and PSAM4‐GlyR EHT. B–F, mean values ± SD for various electrophysiological parameters. B, maximum diastolic potential (MDP); C, amplitude of action potential (APA); D, cycle length (CL); E, action potential duration at that 90% repolarization (APD90); F, maximum upstroke velocity (V max). The number of EHT/number of batches is given as n/n and different shades indicate different batches. Groups (Control, PSAM: PSAM‐GlyR and PSAM4: PSAM4‐GlyR) are compared using one‐way ANOVA, and P‐values are provided in the graph. Measurements were performed in Tyrode's solution. [Colour figure can be viewed at wileyonlinelibrary.com]
Figure 3
Figure 3. PSAM‐GlyR expression in hiPSC‐CMs associated with some ‘constitutively leak’ current
A, time courses of currents measured at −75 mV in hiPSC‐CMs expressing PSAM‐GlyR (red) and hiPSC‐CMs expressing PSAM4‐GlyR (blue). Cells were exposed to 1 mM picrotoxin (PTX) initially and then to 50 nM varenicline (hiPSC‐CMs expressing PSAM4‐GlyR) or 50 µM PSEM89S (hiPSC‐CMs expressing PSAM‐GlyR). B and C, mean values ± SD for increase in current by 50 µM PSEM89S or 50 nM varenicline in the absence and presence of 1 mM PTX. The number of hiPSC‐CMs/number of EHTs/number of batches are given as n/n/n and different shapes within the groups indicate different batches. Groups are compared using unpaired t test, and P‐values are provided in the graph. [Colour figure can be viewed at wileyonlinelibrary.com]
Figure 4
Figure 4. Charge carrier for PSAM‐GlyR and PSAM4‐GlyR was chloride and the agonists PSEM89S and varenicline showed the expected potency
A, current–voltage relationship of PSAM89S‐ and varenicline‐evoked currents. The reversal potential and liquid–liquid junction potential (LLJP) are indicated by an arrow. Mean values ± SD for normalized currents. n/n indicates the number of hiPSC‐CMs/number of EHTs. B, time courses of inward currents at −75 mV in hiPSC‐CMs expressing PSAM‐GlyR or PSAM4‐GlyR exposed to increasing concentrations of PSEM89S or varenicline. C, concentration–effect curve for PSEM89S and varenicline. Basal current density of PSAM and PSAM4‐GlyR‐hiPSC‐CMs is compared using unpaired t test, and P‐values are provided in the graph. Mean values ± SD for chloride current density (I m), and n/n/n indicates the number of hiPSC‐CMs/number of EHTs/number of batches. [Colour figure can be viewed at wileyonlinelibrary.com]
Figure 5
Figure 5. Concentration‐dependent effects of varenicline on action potential characteristics in PSAM4‐GlyR EHT
A, action potential traces at baseline and at increasing varenicline concentrations. B, time course of action membrane potential recorded in PSAM4‐GlyR EHT exposed to increasing concentration of varenicline in PSAM4‐GlyR EHT. AP stopped at a varenicline concentration of 30 nM (indicated by an arrow). The black line after this point represents only maximal diastolic potential (MDP). C, concentration–effect curve for varenicline effect on MDP and maximum upstroke velocity (V max). Note that plotted EC50 values are calculated from the MDP concentration–response curve. Two out of 11 EHTs stopped beating at 10 nM varenicline and 6 out of 11 EHTs stopped beating at 30 nM varenicline. Mean values ± SD for MDP (black) or V max (red). The number of EHTs/number of batches are given as n/n. [Colour figure can be viewed at wileyonlinelibrary.com]
Figure 6
Figure 6. Relationship between activated chloride current and AP parameters
A, original action potential traces recorded in PSAM4‐GlyR EHTs in the presence of cumulatively increasing varenicline concentrations (1 nM steps up to 20 nM), illustrating the shift of the membrane potential. B, comparison between the chloride current density on the maximal diastolic potential (MDP) and beating rate in PSAM4‐GlyR EHT. Data are taken from patch clamp and sharp microelectrode measurements at matching varenicline concentrations. Note that 2 out of 11 EHTs stopped beating at 10 nM varenicline and 6 out of 11 EHTs stopped beating at 30 nM varenicline. Mean values ± SD for MDP (black) or beating rate (red). The number of EHTs/number of batches are given as n/n. C, maximum beating rate at 10 nM varenicline represented by two action potentials in PSAM4‐GlyR EHT. [Colour figure can be viewed at wileyonlinelibrary.com]
Figure 7
Figure 7. PSAM‐GlyR and PSAM4‐GlyR activation stopped contractility in engineered heart tissue
A, video‐optical contractility measurement of control (n = 7) and PSAM‐GlyR EHT (n = 11). B, video‐optical contractility measurement of control (n = 14) or PSAM4‐GlyR EHT (n = 8). C, change in EHT length from diastole to systole and during PSEM89S or varenicline treatment, respectively. Length was normalized to diastolic length. n = 4/3. One‐way ANOVA with multiple comparisons. P‐values are provided in the graph. D–F, contractility measurement during long‐term silencing by constant PSEM89S (D and F) after a culture period of (D) ∼1 month and (F) ∼2 months or varenicline application (E; n = 4/3/3 EHTs per group). Mean values ± SD for contractile force (A and B) and EHT length (C). n indicates the number of EHTs. [Colour figure can be viewed at wileyonlinelibrary.com]
Figure A1
Figure A1. Molecular characterization of PSAM4‐GlyrR knock‐in
[Colour figure can be viewed at wileyonlinelibrary.com]
Figure A2
Figure A2. PSEM89S but not varenicline prolonged action potential duration
[Colour figure can be viewed at wileyonlinelibrary.com]
Figure A3
Figure A3. Concentration‐dependent effect of PSEM89S on AP characteristics in PSAM‐GlyR EHT
[Colour figure can be viewed at wileyonlinelibrary.com]

Similar articles

References

    1. Armstrong, L. C. , Kirsch, G. E. , Fedorov, N. B. , Wu, C. , Kuryshev, Y. A. , Sewell, A. L. , Liu, Z. , Motter, A. L. , Leggett, C. S. , & Orr, M. S. (2017). High‐throughput patch clamp screening in human α6‐containing nicotinic acetylcholine receptors. Society for Laboratory Automation and Screening Discovery, 22(6), 686–695. - PMC - PubMed
    1. Bhagwan, J. R. , Collins, E. , Mosqueira, D. , Bakar, M. , Johnson, B. B. , Thompson, A. , Smith, J. G. W. , & Denning, C. (2020). Variable expression and silencing of CRISPR‐Cas9 targeted transgenes identifies the AAVS1 locus as not an entirely safe harbour. F1000Research, 8, 1911. - PMC - PubMed
    1. Breckwoldt, K. , Letuffe‐Brenière, D. , Mannhardt, I. , Schulze, T. , Ulmer, B. , Werner, T. , Benzin, A. , Klampe, B. , Reinsch, M. C. , Laufer, S. , Shibamiya, A. , Prondzynski, M. , Mearini, G. , Schade, D. , Fuchs, S. , Neuber, C. , Krämer, E. , Saleem, U. , Schulze, M. L. , … Hansen, A. (2017). Differentiation of cardiomyocytes and generation of human engineered heart tissue. Nature Protocols, 12(6), 1177–1197. - PubMed
    1. Das, P. , & Dillon, G. H. (2005). Molecular determinants of picrotoxin inhibition of 5‐hydroxytryptamine type 3 receptors. Journal of Pharmacology and Experimental Therapeutics, 314(1), 320–328. - PubMed
    1. Eschenhagen, T. , & Weinberger, F. (2024). Challenges and perspectives of heart repair with pluripotent stem cell‐derived cardiomyocytes. Nature Cardiovascular Research, 3(5), 515–524. - PubMed

LinkOut - more resources