. 2024 Oct 3;8(10):e0532.
doi: 10.1097/HC9.0000000000000532. eCollection 2024 Oct 1.

MCAM is a prognostic biomarker in patients with liver cirrhosis and HCC

Affiliations

MCAM is a prognostic biomarker in patients with liver cirrhosis and HCC

Eva Stockinger et al. Hepatol Commun. .

Abstract

Background: Despite the rising prevalence of liver cirrhosis and HCC worldwide, reliable prognostic blood biomarkers are lacking. Melanoma cell adhesion molecule (MCAM) is a cell adhesion protein, and its cleavage by metalloproteinases, known to be enriched in fibrotic and malignant diseases, results in the release of a soluble form into the blood. The aim of this study was to characterize MCAM expression in patients with chronic liver disease and to evaluate soluble MCAM (sMCAM) as a prognostic blood biomarker in patients with liver cirrhosis and HCC.

Methods: Expression of MCAM in liver tissue was assessed using transcriptomic data sets as well as by immunohistochemical analyses in patients with liver cirrhosis and HCC. Moreover, sMCAM blood levels were determined in plasma samples from healthy controls (n = 8), patients with chronic liver disease (n = 66), liver cirrhosis (n = 236), and HCC (n = 72).

Results: Single-cell RNA sequencing and immunohistochemistry indicated MCAM to be highly expressed by liver endothelial cells and fibroblasts. Expression was upregulated in liver tissue of patients with liver fibrosis and especially HCC independent of the underlying etiology (p < 0.05, respectively). Blood levels of sMCAM increased with fibrosis stage and peaked in patients with concomitant HCC, showing a comparable diagnostic performance as the fibrosis markers hyaluronic acid (HA) and TIMP1 for diagnosis of liver cirrhosis (AUROCsMCAM = 0.84, AUROCHA = 0.89, AUROCTIMP1 = 0.87) and as alpha-fetoprotein (AFP) for diagnosis of HCC (AUROCsMCAM = 0.72, AUROCAFP = 0.72). Finally, high sMCAM levels predicted worse survival in HCC (p < 0.001).

Conclusions: Collectively, our study suggests sMCAM as a blood biomarker of a liver microenvironment that drives the progression of liver disease in patients with liver cirrhosis and HCC.


Conflict of interest statement

Dominik Bettinger is on the speaker’s bureau for Gore and Falk Foundation. He received grants from Abbvie. Simon Johannes Garing received grants from Ipsen, Gilead, and Schwiete Foundation. Friedrich Foerster advises and is on the speaker’s bureau for AstraZeneca and Roche. He advises BMS and Eisai. He is on the speakers’ bureau for MSD and Pfizer. He received grants from Merck KGaA and Servier. Bertram Bengsch advises for Roche. The remaining authors have no conflicts to report.

Figures

FIGURE 1
FIGURE 1
MCAM is overexpressed in the livers of patients with liver fibrosis and HCC. (A) MCAM gene expression in the livers of patients with MASH with mild fibrosis (F0–1, n = 40) versus advanced fibrosis (F3–F4, n = 32) is shown as signal intensity (GSE49541, p = 0.003, U test). All patients of this cohort were diagnosed with previous diagnosis criteria for nonalcoholic steatohepatitis. (B) MCAM gene expression in the livers of patients with alcoholic steatosis (n = 6) versus alcoholic cirrhosis (n = 67) is shown as signal intensity (GSE103580, p = 0.03, U test). (C) MCAM gene expression in the livers of patients with chronic HBV infection and mild fibrosis (fibrosis stage 0–2, n = 96) versus advanced fibrosis (fibrosis stage 3–4, n = 28) is shown as signal intensity (GSE84044, p = 0.01, U test). (D) MCAM gene expression in HCC tumorous (n = 115) versus nontumor adjacent liver tissue (n = 52) is shown as signal intensity (GSE76427, p < 0.0001, U test). Shown values correspond to measured signal intensities in the respective microarrays and are not comparable between different data sets and cohorts. *p < 0.05; **p < 0.01; ***p < 0.001; ****p < 0.0001. Abbreviations: ASH, alcoholic steatohepatitis; cHBV, chronic Hepatitis B virus infection; MASH, metabolic dysfunction–associated steatohepatitis; MCAM, melanoma cell adhesion molecule.
FIGURE 2
FIGURE 2
Endothelial cells and fibroblasts show the highest expression of MCAM in healthy and diseased liver. (A) Representative microscopic images showing MCAM staining by immunohistochemistry in HCC liver tissue and its corresponding adjacent nontumorous liver tissue from different patients with HCC (n = 3 representative out of 9 in total). Size bars indicate 20 μm. (B) MCAM-positive area (%) by IHC in HCC tumorous and adjacent liver tissue was quantified and is shown as normalized MCAM expression (n = 9 donors, n = 3–8 slices/biological replicates per donor, p < 0.0001, U test). (C) MCAM gene expression on a single-cell level in different liver resident cell types derived from healthy liver is shown as gene UMAP (GSE124395). (D) MCAM gene expression on a single-cell level in different nonmalignant cells derived from HCC is shown as gene UMAP (GSE151530). (E) Cell type enrichment analysis in MCAM high or low expressing HCC tumors (GSE112790). Shown are xCell scores (dots represent individual tumor samples) for Hepatocytes as “Parenchyme” and the composite scores for the stromal and immune microenvironment (p = 0.008, p < 0.0001, and p = 0.11, U test, respectively). (F) Stromal cell type enrichment analysis in MCAM high versus low expressing HCC tissue (GSE112790). Box plots indicate xCell scores for the corresponding stromal cell types in MCAM high versus low expressing HCCs (p < 0.0001, p = 0.008, p = 0.15, p = 0.06 U test). xCell scores for pericytes are shown as HSCs, the liver-specific pericyte compartment. (G) Stromal cell type enrichment analysis in MCAM high or low expressing MASH tissue (GSE49541, p = 0.02, p = 0.02, p = 0.16, p = 0.56, U test). xCell scores for pericytes are shown as HSCs, the liver-specific pericyte compartment. All patients of this cohort were diagnosed with previous diagnosis criteria for NASH. *p<0.05; **p<0.01; ***p<0.001; *****p<0.0001; Abbreviations: CAFs, cancer-associated fibroblasts; EPCAM, epithelial cell adhesion molecule; FDR, false discovery rate; MASH, metabolic dysfunction–associated steatohepatitis; MCAM, melanoma cell adhesion molecule; MSC, mesenchymal stem cell; NES, normalized enrichment score; NK, natural killer cell; NKT, natural killer T cell; TAMs, tumor-associated macrophages; TECs, tumor endothelial cells; Tregs, regulatory T cell; UMAP, Uniform Manifold Approximation and Projection for Dimension Reduction.
FIGURE 3
FIGURE 3
sMCAM blood levels show similar diagnostic performance in the diagnosis of liver cirrhosis as TIMP1. (A) sMCAM blood levels in healthy controls (n = 8) versus patients with different stages of chronic liver disease (F0–F4: n = 65) (p = 0.003, p = 0.001, p = 0.0001, p = 0.0007, respectively, U test). (B) ROC curve for the performance of sMCAM blood levels in the prediction of F4 fibrosis/liver cirrhosis diagnosis (AUROC = 0.84, p = 0.0001). (C) ROC curve for the performance of TIMP1 blood levels in the prediction of F4 fibrosis/liver cirrhosis diagnosis (AUROC = 0.87, p < 0.0001). *p < 0.05; **p < 0.01; ***p < 0.001; ****p < 0.0001. Abbreviations: F0–4, stages of chronic liver disease; MCAM, melanoma cell adhesion molecule; ROC curve, receiver operating characteristic curve; sMCAM, soluble melanoma cell adhesion molecule.
FIGURE 4
FIGURE 4
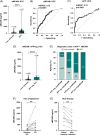
sMCAM blood levels are increased in HCC and model clinical tumor course. (A) sMCAM blood levels in patients with liver cirrhosis (n = 236) versus patients with HCC (n = 72) (p < 0.0001, U test). sMCAM blood levels were detectable in 92% of patients with HCC compared to 61% of patients with liver cirrhosis. (B) ROC curve for performance of sMCAM blood levels in HCC diagnosis (AUROC = 0.72, p < 0.0001). (C) ROC curve for the performance of AFP blood levels in the prediction of HCC diagnosis (AUROC = 0.72, p < 0.0001). (D) sMCAM blood levels in patients with liver cirrhosis (n = 236) versus patients with AFP-negative HCC (n = 38) (p < 0.0001, U test). (E) Proportion of patients with liver cirrhosis and HCC in the AFPnegsMCAMlow-, AFPnegsMCAMhigh-, AFPpossMCAMlow-, and AFPpossMCAMhigh subgroups. (F) sMCAM blood levels in patients with HCC before versus after radiologically confirmed tumor progression (n = 10, p = 0.002, Wilcoxon matched pairs test). (G) sMCAM blood levels in patients with HCC before versus after resection (n = 9, p = 0.004, Wilcoxon matched pairs test). *p<0.05; **p<0.01; ***p<0.001; ****p<0.0001. Abbreviations: AFP, alpha-fetoprotein; MCAM, melanoma cell adhesion molecule; PD, progressive disease; ROC curve, receiver operating characteristic curve; SD, stable disease; sMCAM, soluble melanoma cell adhesion molecule.
FIGURE 5
FIGURE 5
sMCAM blood levels correlate with noninvasive markers of liver cirrhosis and are highly prognostic in patients with HCC. (A) sMCAM blood levels in patients with liver cirrhosis and liver stiffness by transient elastography <25 (n = 23) or ≥25 kPa (n = 19) (p = 0.001, U test). (B) sMCAM blood levels in patients with liver cirrhosis and MELD scores ≤9 or 10–19 or ≥20 points (n = 109, n = 117, and n = 10, respectively) (p = 0.001, p = 0.0005, p = 0.04, respectively, U test). (C) Kaplan-Meier survival curves for patients with HCC and high or low sMCAM blood levels (p = 0.0007, log-rank test). Cutoff blood level of 407.9 ng/mL was determined using the ROC statistic and the Youden Index for differentiation of patients with liver cirrhosis and HCC with detectable sMCAM levels. (D) Kaplan-Meier survival curves for patients with AFP-negative HCC and high or low sMCAM blood levels (cutoff: 407.9 ng/mL, p = 0.006, log-rank test). *p < 0.05; **p < 0.01; ***p < 0.001; ****p < 0.0001. Abbreviations: AFP, alpha-fetoprotein; MCAM, melanoma cell adhesion molecule; sMCAM, soluble melanoma cell adhesion molecule.

References

    1. Tsochatzis EA, Bosch J, Burroughs AK. Liver cirrhosis. Lancet. 2014;383:1749–1761. - PubMed
    1. Ascione A, Fontanella L, Imparato M, Rinaldi L, de Luca M. Mortality from cirrhosis and hepatocellular carcinoma in Western Europe over the last 40 years. Liver Int. 2017;37:1193–1201. - PubMed
    1. Sanyal AJ, Shankar SS, Yates KP, Bolognese J, Daly E, Dehn CA, et al. . Diagnostic performance of circulating biomarkers for non-alcoholic steatohepatitis. Nat Med. 2023;29:2656–2664. - PMC - PubMed
    1. European Association for the Study of the Liver . Electronic address: easloffice@easloffice.eu, Clinical Practice Guideline Panel, Chair:, EASL Governing Board representative:, Panel members: EASL Clinical Practice Guidelines on non-invasive tests for evaluation of liver disease severity and prognosis—2021 update. J Hepatol. 2021;75:659–689. - PubMed
    1. Reig M, Forner A, Rimola J, Ferrer-Fàbrega J, Burrel M, Garcia-Criado Á, et al. . BCLC strategy for prognosis prediction and treatment recommendation: The 2022 update. J Hepatol. 2022;76:681–693. - PMC - PubMed

MeSH terms