. 2025 Apr 17;15(4):jkaf039.
doi: 10.1093/g3journal/jkaf039.

Dynamic changes in gene expression through aging in Drosophila melanogaster heads

Affiliations

Dynamic changes in gene expression through aging in Drosophila melanogaster heads

Katherine M Hanson et al. G3 (Bethesda). .

Abstract

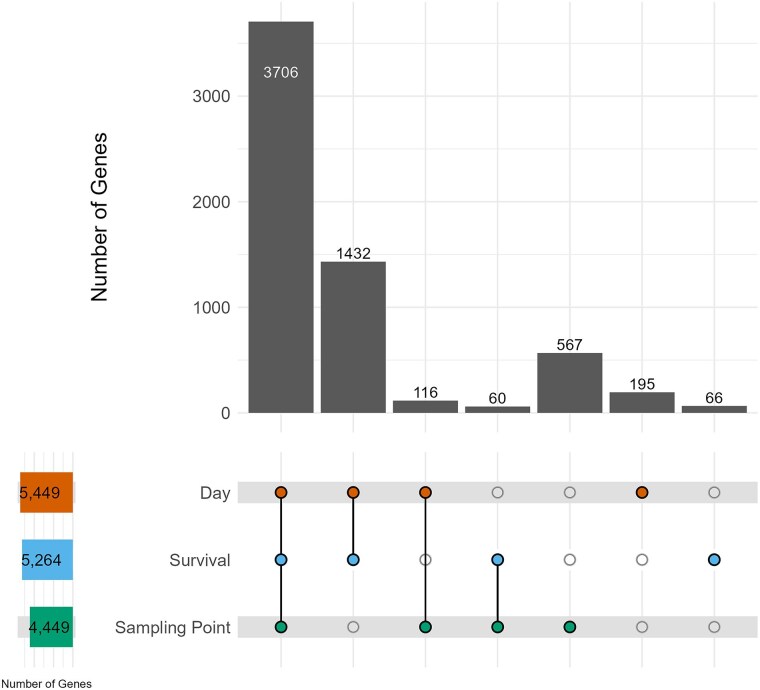
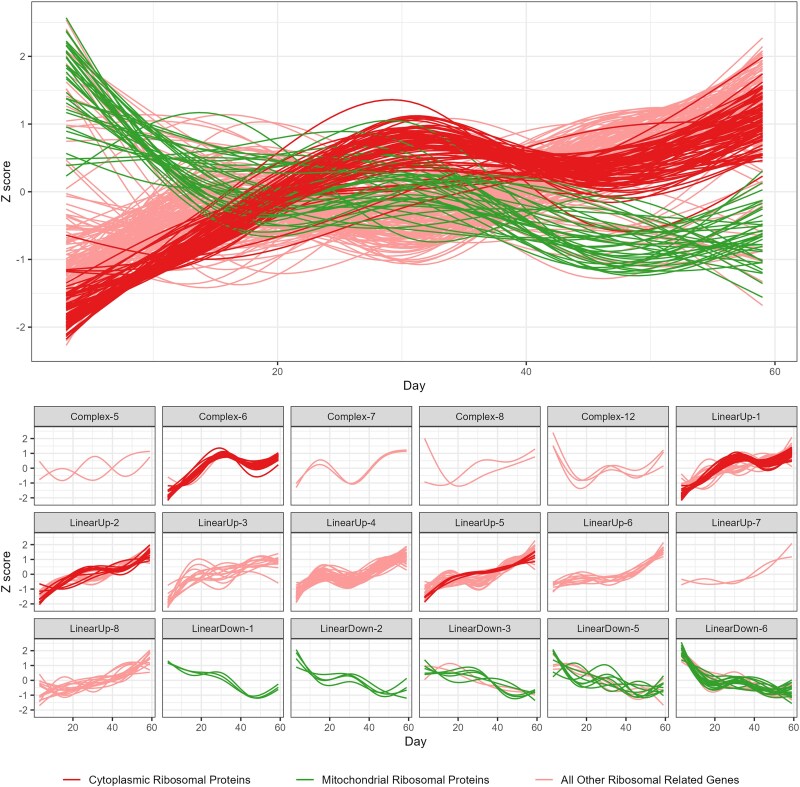
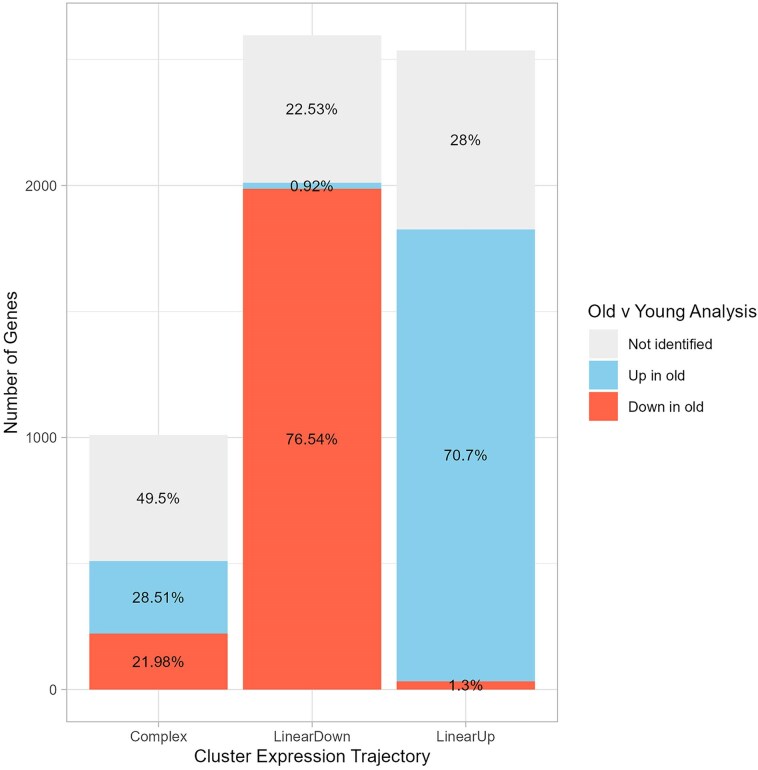
Work in many systems has shown large-scale changes in gene expression during aging. However, many studies employ just 2 arbitrarily chosen timepoints to measure expression and can only observe an increase or a decrease in expression between "young" and "old" animals, failing to capture any dynamic, nonlinear changes that occur throughout the aging process. We used RNA sequencing to measure expression in male head tissue at 15 timepoints through the lifespan of an inbred Drosophila melanogaster strain. We detected >6,000 significant, age-related genes, nearly all of which have been seen in previous Drosophila aging expression studies and that include several known to harbor lifespan-altering mutations. We grouped our gene set into 28 clusters via their temporal expression change, observing a diversity of trajectories; some clusters show a linear change over time, while others show more complex, nonlinear patterns. Notably, reanalysis of our dataset comparing the earliest and latest timepoints-mimicking a 2-timepoint design-revealed fewer differentially expressed genes (around 4,500). Additionally, those genes exhibiting complex expression trajectories in our multitimepoint analysis were most impacted in this reanalysis; their identification, and the inferred change in gene expression with age, was often dependent on the timepoints chosen. Informed by our trajectory-based clusters, we executed a series of gene enrichment analyses, identifying enriched functions/pathways in all clusters, including the commonly seen increase in stress- and immune-related gene expression with age. Finally, we developed a pair of accessible Shiny apps to enable exploration of our differential expression and gene enrichment results.

Keywords: FlyBase; aging; gene expression; gene ontology enrichment; lifespan.


Conflict of interest statement

Conflicts of interest: The author(s) declare no conflicts of interest.

Figures

Fig. 1.
Fig. 1.
Kaplan–Meier survivorship curve for over 5,000 males from the inbred A4 strain. Each point represents 1 day of the experiment, with black points denoting days when only the number of dead flies were counted, and red points denoting those days when flies were also sampled for subsequent RNA isolation (SP1–SP15).
Fig. 2.
Fig. 2.
Identification of 6,142 genes with age-related gene expression changes. We identified genes whose expression was significantly associated with Day of life (n = 5,449), with Survival (n = 5,264), and with Sampling Point (n = 4,449). The upper bar chart shows the number of significant genes identified, with colored circles below showing which analysis the genes were identified in (3,706 genes were identified in all 3 analyses, 1,432 genes were identified in both the Day and Survival analyses, and so on).
Fig. 3.
Fig. 3.
Clustering all 6,142 age-related genes into 28 clusters via their expression trajectories through lifespan. A simplified dendrogram representing the hierarchical clustering of our gene expression trajectory data. Each horizontal colored line represents all those genes in each of our 28 clusters; the closer clusters are to each other on the plot, the more similar their expression trajectories (see Fig. 4). Each cluster is named based on their expression trajectory (LinearUp, LinearDown, and Complex). Complex-1 to Complex-5 clusters are not individually labeled since they are very close together in the plot. Supplementary Fig. 3 shows the full dendrogram highlighting the relationships among all 6,142 genes.
Fig. 4.
Fig. 4.
Representative expression trajectories for all 28 clusters. Within a cluster, we calculated the average Z-score (y-axis) over genes for each timepoint and present a smoothed curve through those points highlighting the cluster-specific changes in gene expression over time in days (x-axis). We determined whether each cluster-specific set of mean Z-scores was statistically associated with age and used this information to designate each cluster as LinearUp or LinearDown (a significant association and expression either increases or decreases over time) or as Complex (there was no significant association between expression and age). This led to 14 Complex, 8 LinearUp, and 6 LinearDown clusters.
Fig. 5.
Fig. 5.
Expression trajectories of ribosome-related protein-coding genes. We examined the expression patterns of mitochondrial ribosomal protein genes (n = 36, green), cytoplasmic ribosomal protein genes (n = 80, red), and all other ribosomal-related genes (n = 154, pink). All mitochondrial ribosomal genes are within LinearDown clusters, all cytoplasmic ribosomal genes are found within LinearUp cluster or Complex-6 (which has an overall increase in expression), and 140/154 of the remaining genes are found within LinearUp or Complex clusters.
Fig. 6.
Fig. 6.
Differences between a multitimepoint and a 2-timepoint analysis. Our 3 trajectory-based analyses revealed >6,000 differentially expressed genes that were grouped into 3 trajectories (Complex, LinearDown, and LinearUp). We compared these results with a reanalysis of a subset of the same data, where we directly contrasted expression between young (days 3 + 6) and old (day 59) samples. Each vertical bar depicts the fraction (in the figure) and the number (y-axis) of genes in each of our expression trajectories that are absent in the young vs old test (gray), are significantly upregulated in old animals (blue), or are significantly downregulated in old animals (red). Most genes with linear trajectories are reidentified, and ∼99% of those show the expected direction of change with age. However, only ∼50% of the Complex trajectory genes are reidentified in the 2-timepoint analysis, and these are split between those that appear to increase or to decrease in expression with age.

Update of

References

    1. Alic N, Giannakou ME, Papatheodorou I, Hoddinott MP, Andrews TD, Bolukbasi E, Partridge L. 2014. Interplay of dFOXO and two ETS-family transcription factors determines lifespan in Drosophila melanogaster. PLoS Genet. 10(9):e1004619. 10.1371/journal.pgen.1004619. - DOI - PMC - PubMed
    1. Bajgiran M, Azlan A, Shamsuddin S, Azzam G, Halim MA. 2021. Data on RNA-seq analysis of Drosophila melanogaster during ageing. Data Brief. 38:107413. 10.1016/j.dib.2021.107413. - DOI - PMC - PubMed
    1. Bordet G, Lodhi N, Kossenkov A, Tulin A. 2021. Age-related changes of gene expression profiles in Drosophila. Genes (Basel). 12(12):1982. 10.3390/genes12121982. - DOI - PMC - PubMed
    1. Broer L, Buchman AS, Deelen J, Evans DS, Faul JD, Lunetta KL, Sebastiani P, Smith JA, Smith AV, Tanaka T, et al. . 2015. GWAS of longevity in CHARGE consortium confirms APOE and FOXO3 candidacy. J Gerontol A Biol Sci Med Sci. 70(1):110–118. 10.1093/gerona/glu166. - DOI - PMC - PubMed
    1. Cai N, Wu Y, Huang Y. 2022. Induction of accelerated aging in a mouse model. Cells. 11(9):1418. 10.3390/cells11091418. - DOI - PMC - PubMed

LinkOut - more resources