. 2025 May 27;9(10):2473-2488.
doi: 10.1182/bloodadvances.2024015364.

Nilotinib attenuates vascular pathology in experimental cerebral malaria

Affiliations

Nilotinib attenuates vascular pathology in experimental cerebral malaria

Luana S Ortolan et al. Blood Adv. .

Abstract

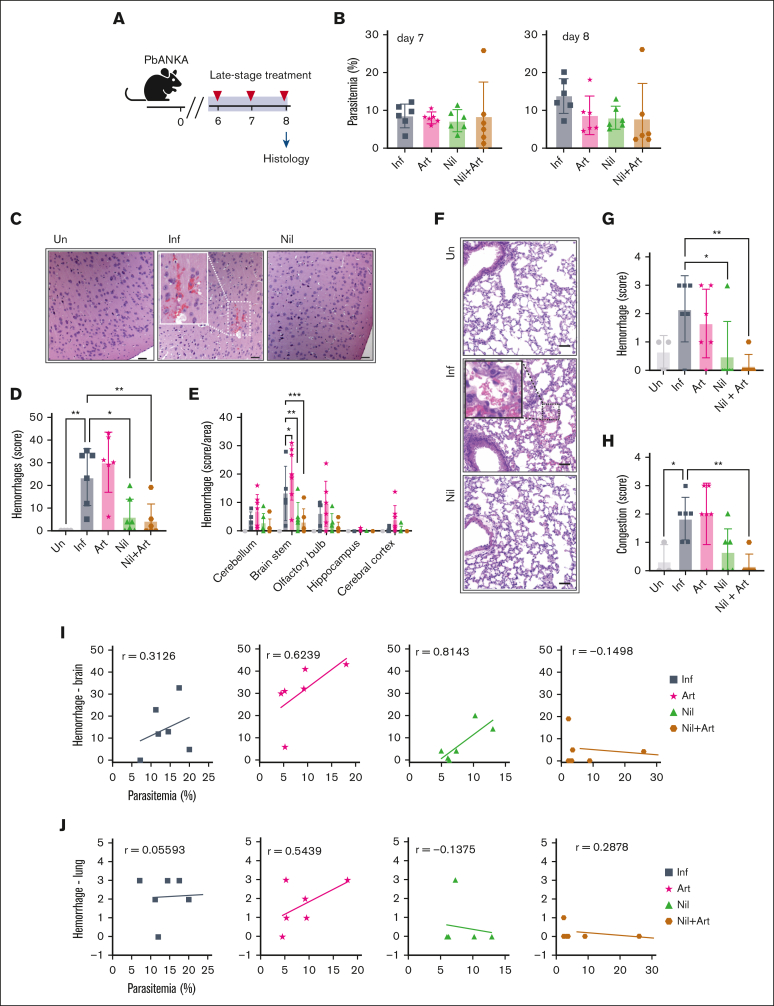
Cerebral malaria (CM), a life-threatening complication of Plasmodium falciparum infection, is characterized by the sequestration of infected erythrocytes in the brain microvasculature. Our study investigated the potential of repurposing tyrosine kinase inhibitors targeting BCR-ABL1 (BCR-ABL drugs), which are also known to be effective against P falciparum blood-stage parasites, for mitigating inflammation and blood-brain barrier breakdown in CM. Our analysis demonstrated differential protective effects of BCR-ABL drugs on primary human brain microvascular endothelial cells exposed to thrombin or a P falciparum-infected erythrocyte challenge. Bosutinib attenuated both thrombin- and parasite-induced barrier alterations, whereas nilotinib was only effective against thrombin, and imatinib protected against neither. Bosutinib's barrier protective effect was associated with reduced interendothelial gap formation and decreased phosphorylation of the adherens junction protein VE-cadherin and the focal adhesion protein paxillin. In the mouse experimental CM model, nilotinib showed superior efficacy over imatinib and bosutinib. In mice, nilotinib led to fewer brain hemorrhages and less vascular congestion than the antimalaria drug artesunate at similar levels of parasitemia control. Our findings provide important mechanistic insight into the activities of BCR-ABL drugs to suppress endothelial barrier disruptive signaling in vitro and to protect in a mouse model of CM. These findings can inform the repurposing of these drugs in malaria treatment, particularly for managing cerebral complications.


Conflict of interest statement

Conflict-of-interest disclosure: The authors declare no competing financial interests.

Figures

None
Graphical abstract
Figure 1.
Figure 1.
Bosutinib and nilotinib can attenuate Thr-induced barrier disruption in HBMECs. (A) Left, schematic overview. An xCELLigence assay was used to measure thrombin (Thr)-induced barrier disruption in an HBMEC monolayer. Traces were normalized to media control. KIs (0.5 μM) were added 7 minutes after Thr to assess barrier protective activity. Right: the total change in the cell index is summarized as the area under the curve (AUC) quantification relative to that of DMSO treatment (100%). The data are presented as mean ± standard deviation (SD; n = 3, each done in duplicate). (B) Dose titration of bosutinib, nilotinib, and imatinib in the xCELLigence assay in Thr-treated HBMECs. The data are presented as mean ± SD (n = 5, each done in triplicate). (C) Top, quantification of Thr-induced barrier permeability at the maximum disruption time point (25 minutes) and at a mid-recovery time point (50 minutes), determined using xCELLigence assay. The data are presented as means ± SD (n = 3, each done in duplicate). Bottom left, representative confocal images of HBMECs under resting or Thr-activated conditions at 50 minutes in the presence or absence of KIs (0.5 μM). The fluorescence of VE-cadherin (green), phalloidin (red), and DAPI (blue) are shown. Gaps are indicated as white arrowheads. Bottom right panel: the highlighted blue areas represent gaps in the monolayer. ImageJ quantification showing the percentage intercellular gaps per field, calculated from 8 uniformly sampled fields (n = 3). A 1-way analysis of variance (ANOVA), followed by Dunnett multiple comparison test, was used to analyze the data. ∗P < .05; ∗∗∗∗P < .0001.
Figure 2.
Figure 2.
Bosutinib attenuates phosphorylation of adherens junctions and focal adhesions during Thr-induced endothelial barrier disruption. (A) A schematic overview of the target selectivity of BCR-ABL drugs against 3 kinases that phosphorylate VE-cadherin (Y685) and paxillin (Y118). (B) Thrombin (Thr)-induced temporal phosphorylation kinetics of VE-cadherin (Y685) and paxillin (Y118) were probed using immunoblotting, along with their respective total proteins. GAPDH was used as a loading control (n = 3). (C) Upper panel, Thr-induced fold change of the indicated phosphoprotein in the presence of DMSO vehicle control or bosutinib is plotted above the respective xCELLigence traces. ImageJ quantification of phosphoproteins levels in panel B was adjusted to the total protein amounts, and fold change was calculated by normalizing to the resting state (nontreated, media only). The data are presented as means ± SD (n = 3). Lower panel, quantification of the KI effect on phosphorylation (total protein normalized) in the presence of KIs or DMSO control (100%). The bars represent the median AUC ± SD (n = 3). A 1-way ANOVA, followed by Dunnett multiple comparison test, was used to analyze the data. ∗P < .05. FAK, focal adhesion kinase; GAPDH, glyceraldehyde-3-phosphate dehydrogenase; pVE-Cadh, protein VE-cadherin.
Figure 3.
Figure 3.
BCR-ABL drugs suppress P falciparum growth in RBCs. (A) Schematic of the 2-cycle P falciparum blood stage growth inhibition assay. (B) Upper panel, 2-fold dose-response curve ranging from 0.1 to 8 μM, followed by a media wash at 55 hours. Parasitemia was measured using SYBR staining with flow cytometry, which was performed at 72 hours. The half-maximal inhibitory concentrations (IC50) of the drugs are indicated. Lower panel, P falciparum asexual intraerythrocytic growth assay. At the ring stage (∼12 h after invasion), media only treatment or treatment with 4 μM KIs or DMSO (vehicle) was applied. The parasites were grown for 2 consecutive growth cycles and the percentage parasitemia was determined using SYBR staining with flow cytometry every 12 hours after infection. The data are presented as means ± SD (n = 3). (C) Representative bright field images of Giemsa-stained blood smears for parasite maturation during drug assay. The percentage of the representative parasite stage is shown at the bottom left corner of each Giemsa-stained image for the respective time point and treatment condition. Scale bar = 5 μm. RBCs, red blood cells.
Figure 4.
Figure 4.
Bosutinib can attenuate parasite-induced barrier disruption in HBMECs. (A) Schematic overview of the parasite-permeability assay. Representative xCELLigence recordings of HBMECs treated with lysates from 3D7 Pf-IEs. The traces were normalized to that of uninfected RBC lysates. KIs (0.5 μM) were added at the same time as the parasite lysate. Right, total change in cell index is summarized as the AUC relative to that of DMSO (100%). The data are presented as the mean ± SD (n = 4, done in duplicate). ∗P < .05 determined using a 1-way ANOVA, followed by Dunnett multiple comparison test (compared with the DMSO/Pf-IEs lysate group). (B) 3D7 Pf-IE lysate–induced phosphorylation of VE-cadherin (Y685) and paxillin (Y118) were probed using immunoblotting, along with their respective total proteins. GAPDH was used as a loading control. The western blot images are representative of 3 independent biologic replicates. (C) Upper panel, the 3D7 Pf lysate–induced fold change of the indicated phosphoproteins levels, adjusted to the total protein amounts (dashed lines), is plotted above the Pf lysate-induced change in the cell index (solid lines), measured using the xCELLigence platform in panel (A). Fold change was calculated by normalizing the data against the data of the resting state (nontreated, media only). Lower panel, The AUC was calculated for the temporal phosphoprotein kinetics (total protein normalized) in the presence of KIs or for the DMSO control (100%). Bars represent the mean AUC ± SD (n = 3). ∗∗∗P < .001; ∗P < .05 determined using 1-way ANOVA, followed by Dunnett multiple comparison test (compared with DMSO control). (D) Upper panel, representative recording of xCELLigence barrier response to schizont-stage IT4var19-IEs (after normalization to uninfected RBCs). DMSO or KIs (0.5 μM) were added after 1 hour of co-culture of purified schizont-stage IEs or RBCs with HBMECs. Lower panel, quantification of barrier protective activity of KIs against schizont-induced barrier disruption. The data are presented as mean ± SD (n = 4, each done in triplicate). ∗∗∗P < .001 determined using a 1-way ANOVA, followed by Dunnett multiple comparison test (compared with the DMSO/Pf-IEs group). GAPDH, glyceraldehyde-3-phosphate dehydrogenase; pVE-Cadh, protein VE-cadherin; RBCs, red blood cells.
Figure 5.
Figure 5.
BCR-ABL drugs attenuate ECM pathology and protect mice when provided before ECM symptoms develop. (A) Schematic overview of the ECM assay. Representative hematoxylin and eosin images of the brain and lung of uninfected (Un) and PbANKA-infected (Inf) mice euthanized on day 7 after infection with RMCBS score <8 (20×; scale bar = 50 μm). The arrowhead indicates brain hemorrhage. (B) Unsupervised hierarchical cluster map of brain and lung edema measured by Evans blue dye on day 7 after infection (gray scale) in comparison with the RMCBS clinical score (blue scale). (C) Schematic overview of the early-infection drug regimen (days 4 to 7). (D) Survival curves (mice were euthanized at an RMCBS score of ≤5; n = 18 Inf; 17 nilotinib [Nil]; 18 bosutinib [Bos]; 18 imatinib [Ima]). ∗P < .05; ∗∗∗∗P < .0001 determined using a log-rank test (Mantel Cox test) in comparison with the Inf group. (E) Parasitemia curves (n = 18 Inf; 17 Nil; 18 Bos; 18 Ima). (F) Brain edema measured by Evans blue assay on day 7 after infection (n = 6 Un; 12 Inf; 11 Nil; 11 Bos; 4 Ima). ∗∗∗∗P < .0001 determined using 1-way ANOVA, followed by Dunnett multiple comparison test (compared with the Inf group). (G) Lung edema measured by Evans blue assay on day 7 after infection (n = 6 Un; 12 Inf; 11 Nil; 11 Bos; 4 Ima). ∗P < .05; ∗∗P < .01 determined using a 1-way ANOVA, followed by Dunnett multiple comparison test (compared with the Inf group).
Figure 6.
Figure 6.
Coadministration of nilotinib with artesunate increased survival and decreased brain edema. (A) Schematic overview of the late-stage treatment regimen (days 6-10) as highlighted by the gray box. (B) Survival curves (mice were euthanized at an RMCBS score ≤ 5; n = 18 per group. ∗P < .05; ∗∗∗∗ P < .0001 analyzed using log-rank tests [Mantel Cox tests] in comparison with the infected group). (C) Parasitemia curves (n = 18 per group). (D) Parasitemia in individual mice on days 7 to 11 after infection. ∗P < .05; ∗∗P < .01 determined using 2-way ANOVA, followed by Tukey multiple comparison test. (E) Giemsa-stained blood smears were used to determine the parasite life stages on day 8 after infection in the no treatment and nilotinib-treated PbANKA-infected mice. (F) Schematic overview of Evans blue dye assay conducted on day 7 or 8. (G) Parasitemia measured on the day of Evans blue dye assay (n = 9 Un; 17 Inf; 18 Art; 18 Nil+Art). ∗ P < .05; ∗∗P < .01 determined using 1-way ANOVA, followed by Dunnett multiple comparison test (compared with the infected group). (H) Brain edema measured by Evans blue assay on day 7 or 8 after infection (n = 9 Un; 17 inf; 18 Art; 18 Nil+Art). ∗P < .05; ∗∗P < .01 determined using 1-way ANOVA, followed by Dunnett multiple comparison test (compared with the infected group). (I) Lung edema measured by Evans blue assay on day 7 or 8 after infection (n = 9 Un; 17 Inf; 18 Art; 18 Nil+Art). ∗∗P < .01 determined using 1-way ANOVA, followed by Dunnett multiple comparison test (compared with the infected group). Art, artesunate.
Figure 7.
Figure 7.
Nilotinib reduces brain and lung hemorrhages in late-stage treatment intervention. (A) Schematic overview of the histology study conducted on day 8 after infection. (B) Parasitemia in mice on day 7 and 8 after infection (n = 6 mice per group). (C) Representative hematoxylin and eosin (H&E)–stained brain sections of uninfected (Un), infected (Inf), and nilotinib (Nil)-treated mice. Hemorrhage (white dashed box) in the cerebral cortex area on day 8 after infection (magnification ×10; scale bar = 100 μm; magnification ∼×3.6, boxed inset). (D) Total brain hemorrhage score. (E) Individual brain area hemorrhage score. (F) Representative H&E lung sections (magnification ×20; scale bar = 50 μm) showing hemorrhage area (black dashed box; magnification ∼×4, boxed inset). Lungs were collected on day 8 after infection. (G) Lung hemorrhage score. (H) Lung congestion score. (I) Correlation of parasitemia and brain hemorrhage score. (J) Correlation of parasitemia and lung hemorrhage score. A 1-way ANOVA, followed by Dunnett multiple comparisons test (compared with the infected group) was used to analyze the data. ∗P < .05; ∗∗P < .01; ∗∗∗P < .01.

References

    1. Lee WL, Slutsky AS. Sepsis and endothelial permeability. N Engl J Med. 2010;363(7):689–691. - PubMed
    1. Miller LH, Ackerman HC, Su XZ, Wellems TE. Malaria biology and disease pathogenesis: insights for new treatments. Nat Med. 2013;19(2):156–167. - PMC - PubMed
    1. Weisberg E, Parent A, Yang PL, et al. Repurposing of kinase inhibitors for treatment of COVID-19. Pharm Res. 2020;37(9):167. - PMC - PubMed
    1. World Malaria Report 2022. Global Malaria Programme; 2022.
    1. Idro R, Kakooza-Mwesige A, Asea B, et al. Cerebral malaria is associated with long-term mental health disorders: a cross sectional survey of a long-term cohort. Malar J. 2016;15:184. - PMC - PubMed

MeSH terms