. 2025 Feb 24;16(1):1928.
doi: 10.1038/s41467-025-57146-5.

Drop-shaped microgrooves guide unidirectional cell migration for enhanced endothelialization

Affiliations

Drop-shaped microgrooves guide unidirectional cell migration for enhanced endothelialization

Xing-Wang Wang et al. Nat Commun. .

Abstract

Atrial fibrillation (AF) significantly increases the risk of ischemic stroke, and in non-valvular AF, 90% of stroke-causing thrombi arise from the left atrial appendage (LAA). Percutaneous LAA occlusion using an occluder is a crucial clinical intervention. However, occluder materials could provoke thrombi, termed device-related thrombosis (DRT), leading to treatment failure. Rapid endothelialization is essential to address the DRT but the occluder's large surface area and irregular cell migration on the surface impede this process. Here, we report a continuous drop-shaped microgroove, which has a drop-shaped unit structure similar to endothelial cells. The microgrooves polarize the cytoskeleton, guiding cell unidirectional migration within the grooves, and increase cell migration efficiency. We show that drop-shaped microgrooves accelerate wound healing in a rat model, and that occluder discs with drop-shaped microgrooves promote endothelialization in a canine model. Together, our results show that integrating microgrooves with medical devices is a promising approach for addressing DRT.


Conflict of interest statement

Competing interests: J.J., K.R., X.W., J.W., G.F., and L.Y. are inventors of a patent related to this work filed by Zhejiang University (2023106046243), the remaining authors declare no competing interests.

Figures
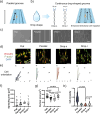
Fig. 1
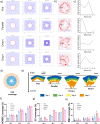
Fig. 1. The interactions between different microgrooves and cells.
a Schematic diagram of parallel microgrooves and their influence on cell migration. b Schematic diagram of drop-shaped microgrooves and their influence on cell migration. c Scanning electron microscope (SEM) images of the flat surface, parallel microgrooves, and drop-shaped grooves. Scale bars, 50 μm. d Confocal microscopy images of cells spreading on different surfaces. Scale bar, 100 μm. Statistics of cells orientation degree (e), cell spreading area (f) (n = 16 cells from three technical replicates), nuclear area (g) (n = 16 cells from three technical replicates), and cell circularity (h) (n = 16 cells from three technical replicates) on different surfaces. Data are presented as means ± standard deviation (SD). Significance determined by unpaired two-tailed t-test (fh).
Fig. 2
Fig. 2. Migration behavior of HUVECs on the surface with different topographies.
a Cell trajectories (n = 11–12 cells) after 2 h of migration on the flat surface or on different microgrooves. Statistical analysis of the b directionality ratio and c speed of cell migration on different surfaces (n = 11 cells). d Comparative analysis of cell migration directionality on different surfaces. e Cell migration process in drop-shaped microgrooves. Red: CellTrackerTM orange. Scale bars are 20 μm. f Staining of keratin (green) and nuclei (blue) of HUVECs migrated on different surfaces. g Quantitative analysis of keratin intensity on different surfaces. The red line indicates the nuclei area. The black arrow represented the RhoA polarization signal. h Staining of RhoA (green) and nuclei (blue) of HUVECs migrated on different surfaces and the quantitative analysis of RhoA fluorescence intensity changes. RhoA activity was detected using fluorescence resonance energy transfer (FRET) biosensor. The black arrow represented the RhoA polarization signal. The data were representative of three independent experiments and expressed as the mean ± standard deviation (SD). Data are presented as means ± SD. Significance determined by unpaired two-tailed t-test (c).
Fig. 3
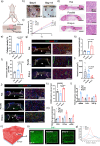
Fig. 3. Simulation and characterization of cell collective migration on different surfaces.
a Simulation diagram of the degree of cell coverage in the central area changing over time. b Cell migration velocity streamline diagram. The black dashed line represents the sampling location for velocity direction. c Cell migration velocity direction diagram at dashed line position. d Schematic diagram of collective cell migration experiment. Created in BioRender. Ji, J. (2025) https://BioRender.com/m39n040. e Diagram of cell migration area towards the central region on different surfaces over time. The black dashed line indicates the farthest position of cell migration. f Diagram of the percentage of the central area covered by HCMEC (f), HUVEC (g), and SMC (h) on different surfaces over time (n = 3 technical replicates). Data are presented as means ± SD (fh).
Fig. 4
Fig. 4. Rat wound healing experiment to assess the interaction between microstructures and tissue.
a Schematic diagram of the experimental design. Created in BioRender. Ji, J. (2025) https://BioRender.com/v94a954. Photos (b) and statistical data (c) of wound area (n = 3 rats per group). d Photos of H&E staining on wound cross-sections (left) and the enlarged image (right). Collagen density (e) and immune cell density (f) counts in H&E staining images (Five measurements of collagen density and immune cell density were taken for 5 different fields of view from 3 rats per group). g Images of CD31 staining (green), αSMA staining (red) and DAPI (blue) on wound cross-sections (left) and the enlarged image (right). Vessel density (h) and vessel area (i) counts in the immunofluorescence staining images (Five measurements of vessel density and twelve measurements of vessels area were taken for 5 different fields of view of 3 rats per group). j Images of CD206 staining (green), CD68 staining (red) and DAPI (blue) on wound cross-sections (left) and the enlarged image (right) (n = 3 rats per group). k CD206-positive cells density in the immunofluorescence staining images (n = 3 rats per group). Relative expression of genes about tissue regeneration (l) and angiogenesis (m). (n = 3 rats per group). n Schematic diagram of the tissue-sample interface. The black dashed line indicates the interface position. Created in BioRender. Ji, J. (2025) https://BioRender.com/a99k506. o Laser confocal scanning images of collagen staining in tissue contacting different surfaces. Green: Collagen I (Col I). p Statistics of collagen fiber orientation in tissue contacting different surfaces. The data were representative of three independent experiments and expressed as the mean ± SD. Significance determined by unpaired two-tailed t-test (c, e, f, h, i, k) and p > 0.05 was considered as not significant.
Fig. 5
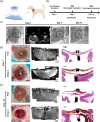
Fig. 5. Implantation of the LAA occluder in the canine model.
a Illustration of transcatheter interventional closure of LAA with the occluder. Created in BioRender. Ji, J. (2025) https://BioRender.com/n35z026. b Illustration of the study design. c Transthoracic echocardiography (TTE) examination during the LAA occlusion. The black dashed circle represents the location of LAA occluder. Angiography image after 7 days and 14 days implantation. Photographs and representative SEM images of the neo-endocardium coverage on the flat occluder and drop-s occluder at 7 days (d) and 14 days (e). Scale bars, 1 cm in the photographs, 2 mm in the SEM images, and 2 mm in the H&E photograph.
Fig. 6
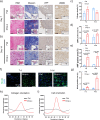
Fig. 6. Histologic examinations of the LAA occluders implanted in the canine LAA.
H&E staining, Masson staining, vWF staining and αSMA staining of neo-tissue on flat and Drop-s surface at 7 days (a) and 14 days (b). Quantitative results of collagen density (c), αSMA-positive area (d), and vWF-positive area (e) at 7 days and 14 days (Five measurements of collagen density and three measurements of positive area were taken for 5 different fields of view from 3 different regions of tissue). f Images of RhoA staining (green) and DAPI (blue) of the neo-tissue at 7 days and 14 days. g Quantitative results of RhoA-positive area (Five measurements of RhoA-positive area were taken for 5 different fields of view from 3 different regions of tissue). Quantitative analysis of collagen orientation (h) and cell orientation (i) results based on tissue section images. The data were expressed as the mean ± SD. Significance determined by unpaired two-tailed t-test and p > 0.05 was considered as not significant.
Fig. 7
Fig. 7. The RNA-seq transcriptome analysis of the tissue collected from the surface of the occluder disk.
a Heatmap of differential genes. b Volcano map of significantly upregulated (red) and downregulated (blue) genes in different groups. c Bubble chart of differential gene enrichment (GO term). Hypergeometric test and Benjamini–Hochberg P value correction algorithm were used to determine enriched GO terms. d Gene enrichment circle chart. Expression changes of collagen organization genes (e), actin cytoskeleton organization genes (f), cell motility genes (g), and tissue regeneration genes (h).

References

    1. Hart, R. G., Pearce, L. A. & Aguilar, M. I. Meta-analysis: antithrombotic therapy to prevent stroke in patients who have nonvalvular atrial fibrillation. Ann. Intern. Med.146, 857–867 (2007). - PubMed
    1. Saposnik, G., Gladstone, D., Raptis, R., Zhou, L. & Hart, R. G. Atrial fibrillation in ischemic stroke. Stroke44, 99–104 (2013). - PubMed
    1. Katsanos, A. H., Kamel, H., Healey, J. S. & Hart, R. G. Stroke prevention in atrial fibrillation. Circulation142, 2371–2388 (2020). - PubMed
    1. Caliskan, E. et al. Interventional and surgical occlusion of the left atrial appendage. Nat. Rev. Cardiol.14, 727–743 (2017). - PubMed
    1. Liuzzo, G. & Patrono, C. Occluding to prevent occlusion. Eur. Heart J.42, 3224–3225 (2021). - PubMed