. 2025 Feb 24;16(1):1917.
doi: 10.1038/s41467-025-57038-8.

Endosomal trafficking participates in lipid droplet catabolism to maintain lipid homeostasis

Affiliations

Endosomal trafficking participates in lipid droplet catabolism to maintain lipid homeostasis

Wang Peng et al. Nat Commun. .

Abstract

The interplay between lipid droplets (LDs) and endosomes remains unknown. Here, we screen and synthesize AP1-coumarin, an LD-specific probe, by conjugating a fluorescent dye coumarin to a triazine compound AP1. AP1-coumarin labels all stages of LDs in live cells and markedly induces the accumulation of enlarged RAB5-RAB7 double-positive intermediate endosomes. The AP1-coumarin-labeled LDs contact these intermediate endosomes, with some LDs even being engulfed in them. When LD biogenesis is inhibited, the ability of AP1-coumarin to label LDs is markedly reduced, and the accumulation of enlarged intermediate endosomes is abolished. Moreover, blocking the biogenesis of LDs decreases the number of late endosomes while increasing the number of early endosomes and inhibits the endosomal trafficking of low-density lipoprotein (LDL) and transferrin. Correspondingly, interference with RAB5 or RAB7, either through knockdown or using dominant-negative mutants, inhibits LD catabolism, whereas the expression of a RAB7 constitutively active mutant accelerates LD catabolism. Additionally, CCZ1 knockdown not only induces the accumulation of intermediate endosomes but also inhibits LD catabolism. These results collectively suggest that LDs and endosomes interact and influence each other's functions, and endosomal trafficking participates in the catabolic process of LDs to maintain lipid homeostasis.


Conflict of interest statement

Competing interests: The authors declare no competing interests.

Figures

Fig. 1
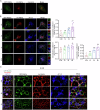
Fig. 1. AP1-C stains LDs of all stages in live cells.
AC Live A549 cells were co-stained with Nile Red (1 μM) and coumarin (10 μM) (n = 8) (A) or AP1- C (10 μM) (B), or Bodipy 493/503 (1 μM) and AP1-C (10 μM) (C) for 1 h, followed by confocal imaging. D, E A549 cells were transiently transfected with mc-ACSL3 (D) or GFP-ADRP (E), then treated with AP1-C (10 μM) for 1 h, followed by confocal imaging. F Pearson correlation coefficient analysis of images in (B–E) was calculated by Zen black software (n = 15 for Nile Red, n = 20 for Bodipy 493/503, n = 15 for ACSL3, and n = 15 for ADRP; compared to the ACSL3 group, p = 0.0069 and p = 0.0034 for ADRP and Bodipy, respectively; p < 0.0001 for Nile Red). G A549 cells were transiently co-transfected with mc-ACSL3 and GFP-ADRP (n = 11), then treated with AP1-C (10 μM) for 1 h or 6 h, followed by confocal imaging. Images were finally captured by a Zeiss 880 microscope with a 63x objective lens. The scale bar is 5 μm. The graphs represented data from three independent experiments, The statistical significance of differences was determined by using the unpaired two-tailed student’s t test, and data quantifications were expressed as mean ± s.e.m. *p < 0.05, **p < 0.01, ***p < 0.001; ns: no significance.
Fig. 2
Fig. 2. LDs contact with endosomes and are engulfed in intermediate endosomes.
A, B A549 cells were transiently transfected with GFP-Rab5a and mc-Rab7a, and then treated with coumarin (10 μM) for 6 h (A) or AP1-C (10 μM) for the indicated time (B), followed by confocal imaging. Images were finally captured by the Zeiss 880 microscope with a 63x objective lens. The scale bar is 5 μm. Manders colocalization coefficients (MCC) were calculated by ImageJ (n = 10, 9, 8, and 8 for 0.5 h, 1 h, 3 h, and 6 h, respectively; compared to 0.5 h, for Rab7a/Rab5a, p = 0.1697, p = 0.0019, and p = 0.0002 for 1 h, 3 h, and 6 h, respectively; for AP1-C/Rab7a, p = 0.5240, p = 0.0151, and p = 0.0001 for 1 h, 3 h, and 6 h, respectively; for AP1-C/Rab5a, p = 0.1446 for 1 h, and p < 0.0001 for 3 h and 6 h). C A549 cells were transiently transfected with mc-Rab5a and GFP-Rab7a, then treated with AP1-C (10 μM) for the indicated times before being fixed by 4% PFA. Images were captured with the N-SIM with a 100x objective lens (n = 3 for each time point). The scale bar is 1 μm. The statistical significance of differences was determined by using the unpaired two-tailed student’s t test. The graphs represented data from three independent experiments, and data quantifications were expressed as mean ± s.e.m. *p < 0.05, **p < 0.01, ***p < 0.001; ns: no significance.
Fig. 3
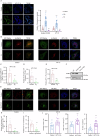
Fig. 3. Biogenesis of LDs is essential for AP1-C-induced enlarged intermediate endosomes.
A A549 cells were treated with DMSO, Oleic acid (OA) (200 μM), or Triacsin C (TC) (5 μM) overnight and then co-stained with Bodipy 493/503 (1 μM) and AP1-C (10 μM) for 1 h, followed by confocal imaging. The fluorescence intensity of cells was quantified by ImageJ (n = 30 for all columns; compared to the control group, for the Bodipy 493/503 group, p < 0.0001 for both OA and TC; for the AP1-C group, p < 0.0001 for both OA and TC). B–E A549 cells were transiently co-transfected with GFP-Rab5a and mc-Rab7a, treated with DMSO or TC (5 μM) overnight, and subsequently treated with DMSO or AP1-C (10 μM) for an additional 6 h before confocal imaging (B). The colocalization (MCC) of Rab5a and Rab7a was quantified using ImageJ (C) (p < 0.0001), the diameter of vacuoles (diameter > 2 µm) was calculated using ZEN Black software (D) (p = 0.0007), and the fluorescence intensity was quantified using ImageJ (E) (p < 0.0001). Sample sizes were n = 8 for the control group and n = 7 for the TC-treated group in (C–E). F Knockdown efficiency of ACSL3 in A549 cells was analyzed by immunoblotting analysis (p < 0.0001). G–J Control or ACSL3-knockdown cells were transiently transfected with GFP-Rab7a, and then treated with DMSO or AP1-C (10 μM) for 6 h, followed by treatment with Nile Red (1 μM) for 30 min (G). Images were finally captured by a Zeiss 880 microscope with a 63x objective lens. The scale bar is 5 μm. The number of GFP-Rab7a-positive vacuoles (diameter >2 µm) in scramble-Sg-expressing cells or ACSL3-Sg-expressing cells was quantified using ZEN black software (H) (n = 17 and 11 for Scramble-Sg and Sg-ACSL3, respectively; p < 0.0001). The fluorescence intensity of AP1-C in scramble-Sg-expressing cells or ACSL3-Sg-expressing cells (I) (n = 17 and 11 for Scramble-Sg and Sg-ACSL3, respectively; p < 0.0001), as well as the number, size, and area of Nile Red-positive LDs in scramble-Sg-expressing cells treated with or without AP1-C (J) were calculated using ImageJ (n = 13 and 17 for control and AP1-C 6 h, respectively; p = 0.0067 for number of LDs, p = 0.0008 for size of LDs, and p < 0.0001for % area of LDs). The graphs represented data from three independent experiments. The statistical significance of differences was determined by using the unpaired two-tailed student’s t test, and data quantifications were expressed as mean ± s.e.m. *p < 0.05, **p < 0.01, ***p < 0.001; ns: no significance.
Fig. 4
Fig. 4. Biogenesis of LDs participates in endosomal trafficking.
A, B Control or ACSL3-knockdown A549 cells were transiently transfected with GFP-Rab5a (A) or GFP-Rab7a (B), and then treated with Nile Red (1 μM) for 30 min, followed by confocal imaging. The number of Rab5-positive early endosomes (EEs) or Rab7-positive late endosomes (LEs) was quantified by ImageJ (n = 20 for both WT and Sg-ACSL3 in (A, B); p = 0.0001 for (A), and p < 0.0238 for (B)). C, D A549 cells were treated with DMSO or TC (5 μM) overnight. The cells were then fixed with 4% PFA, immunostained with antibodies against Rab5a (C) or Rab7a (D), and co-stained with Bodipy 493/503 (1 μM) and DAPI (1 μg/mL) for 30 min. The number of EEs and LEs was quantified by ImageJ (For C, n = 18 for both WT and TC, p = 0.0103; for D, n = 16 and 17 for WT and TC, respectively, and p = 0.0013). E Control or ACSL3-knockdown A549 cells treated with DMSO or AP1 (1 μM) were incubated with LDL-488 on ice for 1 h, and then released into the warm medium for the indicated times, and the fluorescence of LDL was calculated by ImageJ (n = 30 for all groups; at 180 min, compared to WT, p < 0.0001 for both AP1 and Sg-ACSL3, while compared to AP1, p = 0.0731 for ACSL3). Images were captured by a Zeiss 880 microscope with a 63x objective lens. The scale bar is 5 μm. The graphs represented data from three independent experiments. The statistical significance of differences was determined by using the unpaired two-tailed student’s t test, and data quantifications were expressed as mean ± s.e.m. *p < 0.05, **p < 0.01, ***p < 0.001; ns: no significance.
Fig. 5
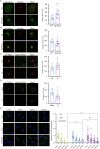
Fig. 5. Inhibiting early endosome maturation compromises the catabolism of LDs.
A The knockdown efficiency of Rab5a in A549 cells was assessed by western blot analysis (n = 3). B Control or Rab5a-knockdown A549 cells were fixed by 4% PFA, and stained with Bodipy 493/503 (1 μM) and DAPI (1 μg/mL) for 30 min. The number, size and area of LDs, as well as the fluorescence intensity of Bodipy 493/503 were quantified by ImageJ (n = 30 for all figures; p < 0.0001 for all figures). C The triglyceride level in control or Rab5a-knockdown A549 cells was determined (p < 0.0029). D A549 cells were transiently transfected with mc-Rab5a or mc-Rab5a-S23N, and then stained with Bodipy 493/503 (1 μM) for 30 min. The number and size of LDs, and fluorescence intensity of Bodipy 493/503 were quantified by ImageJ (n = 13 for all figures; p = 0.0080, 0.0303 and 0.0015 for number of LDs, average size of LDs and relative Bodipy fluorescence, respectively). Images were captured by a Zeiss 880 microscope with a 63x objective lens. The scale bar is 5 μm. The graphs represented data from three independent experiments. The statistical significance of differences was determined by using the unpaired two-tailed student’s t test, and data quantifications were expressed as mean ± s.e.m. *p < 0.05, **p < 0.01, ***p < 0.001; ns: no significance.
Fig. 6
Fig. 6. Inhibiting late endosome maturation impedes the catabolism of LDs.
A The knockdown efficiency of Rab7a in A549 cells was assessed by western blot analysis (p < 0.0001). B Control or Rab7a-knockdown A549 cells were fixed by 4% PFA, and then stained by Bodipy 493/503 (1 μM) and DAPI (1 μg/mL) for 30 min. The number and size of LDs, and fluorescence intensity of Bodipy 493/503 were quantified by ImageJ (n = 30 for all figures; p < 0.0001 for number of LDs and relative Bodipy fluorescence, p = 0.3763 for average size of LDs). C Triglyceride level in control or Rab7a-knockdown A549 cells was determined (p < 0.0001). D A549 cells were transiently transfected with GFP-Rab7a, GFP-Rab7a-T22N, or GFP-Rab7a-Q67L, and then stained with Nile red (1 μM) for 30 min. The number and size of LDs, and fluorescence intensity of Nile Red were quantified by ImageJ (n = 13 for all figures; for number of LDs, p = 0.0097 for Rab7a T22N, p < 0.0001 for Rab7a Q67L; for average size of LDs, p = 0.4779 for Rab7a T22N, p < 0.0001 for Rab7a Q67L; and for relative Bodipy fluorescence, p < 0.0001 for both Rab7a T22N and Rab7a Q67L). Images were captured by a Zeiss 880 microscope with a 63x objective lens. The scale bar is 5 μm. The graphs represented data from three independent experiments. The statistical significance of differences was determined by using the unpaired two-tailed student’s t test, and data quantifications were expressed as mean ± s.e.m. *p < 0.05, **p < 0.01, ***p < 0.001; ns: no significance.
Fig. 7
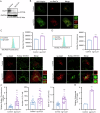
Fig. 7. CCZ1 knockdwon compromises LD biogenesis.
A Knockdown efficiency of CCZ1 in A549 cells was assessed by immunoblot analysis (n = 3). B Control or CCZ1-knockdown A549 cells were transiently transfected with GFP-Rab5 and mc-Rab7 (n = 12), followed by confocal imaging. C, D Control or CCZ1-knockdown A549 cells were stained with Nile Red (1 μM) (C) or Bodipy 493/503 (1 μM) (D) for 1 h, followed by flow cytometry (C: p = 0.0002; D: p = 0.0006). E, F Control or CCZ1-knockdown A549 cells were transiently transfected with mc-Rab5a or mc-Rab7a, and then stained with Bodipy 493/503 (1 μM) for 1 h before fixing by 4% PFA, followed by confocal imaging (E). The number and size of LDs, and fluorescence intensity of Bodipy 493/503 were quantified by ImageJ (F) (n = 20 for all figures; for the number of LDs, p = 0.0046; for relative Bodipy fluorescence and LD size, p < 0.0001). Images were captured by a Zeiss 880 microscope with a 63x objective lens. The scale bar is 5 μm. G Triglyceride level in control or CCZ1-knockdown A549 cells was determined (p < 0.0001). The graphs represented data from three independent experiments. The statistical significance of differences was determined by using the unpaired two-tailed student’s t test, and data quantifications were expressed as mean ± s.e.m. *p < 0.05, **p < 0.01, ***p < 0.001; ns: no significance.

References

    1. Herker, E., Vieyres, G., Beller, M., Krahmer, N. & Bohnert, M. Lipid droplet contact sites in health and disease. Trends Cell Biol.31, 345–358 (2021). - PubMed
    1. Olzmann, J. A. & Carvalho, P. Dynamics and functions of lipid droplets. Nat. Rev. Mol. Cell Biol.20, 137–155 (2019). - PMC - PubMed
    1. Onal, G., Kutlu, O., Gozuacik, D. & Dokmeci Emre, S. Lipid droplets in health and disease. Lipids Health Dis.16, 128 (2017). - PMC - PubMed
    1. Drizyte-Miller, K., Schott, M. B. & McNiven, M. A. Lipid droplet contacts with autophagosomes, lysosomes, and other degradative vesicles. Contact (Thousand Oaks)3, 1–13 (2020). - PMC - PubMed
    1. Renne, M. F. & Hariri, H. Lipid droplet-organelle contact sites as hubs for fatty acid metabolism, trafficking, and metabolic channeling. Front Cell Dev. Biol.9, 726261 (2021). - PMC - PubMed

LinkOut - more resources