. 2025 Feb 24;15(1):6591.
doi: 10.1038/s41598-025-88955-9.

Pan-cancer analysis reveals SMARCAL1 expression is associated with immune cell infiltration and poor prognosis in various cancers

Affiliations

Pan-cancer analysis reveals SMARCAL1 expression is associated with immune cell infiltration and poor prognosis in various cancers

Wu-Jie Zhao et al. Sci Rep. .

Abstract

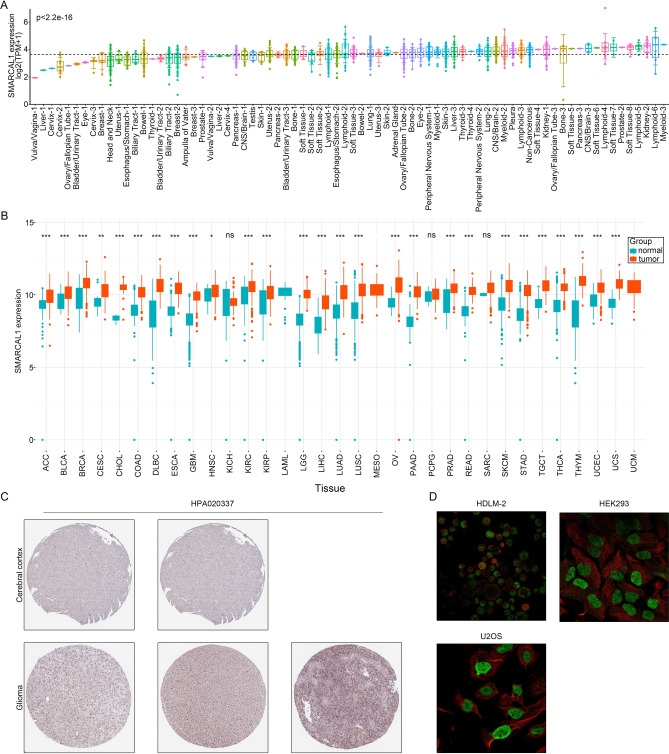
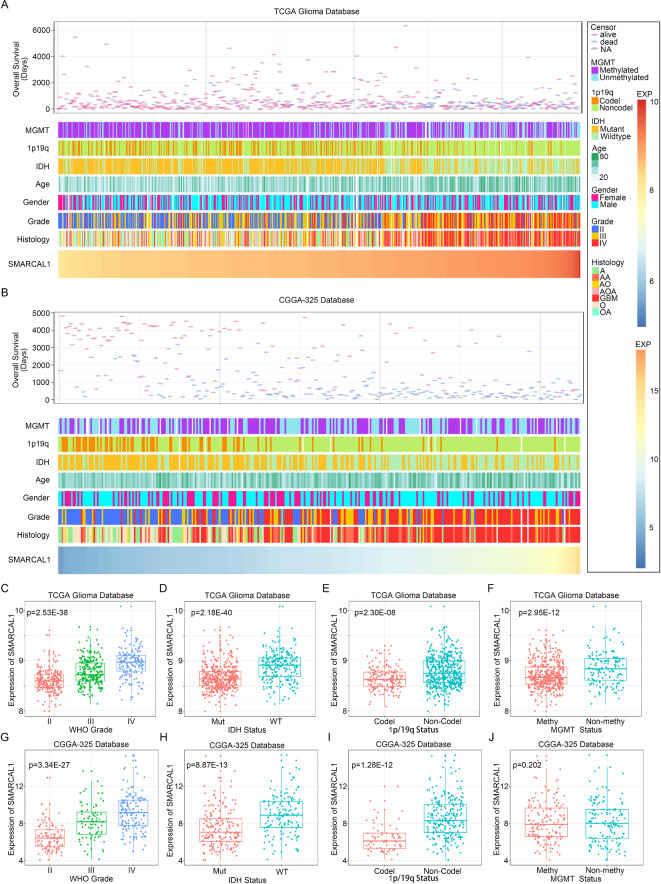
Although immune checkpoint inhibition in particular has shown promise in cancer immunotherapy, it is not always efficient. Recent studies suggest that SMARCAL1 may play a role in tumor immune evasion, yet its pan-cancer role is unclear. We conducted a comprehensive analysis of SMARCAL1 using TCGA, GTEx, and CCLE databases, evaluating its expression, genetic alterations, epigenetic modifications, and their clinical correlations across 33 cancer types. Our findings indicate that SMARCAL1 is overexpressed in several cancers, such as Glioma, LUAD, KIRC, and LIHC, impacting prognosis. Elevated SMARCAL1 is linked to poor outcomes in Glioma, LUAD, and LIHC but correlates with better survival in KIRC. We also found significant associations between SMARCAL1 expression and DNA methylation in 13 cancers. Furthermore, SMARCAL1 expression correlates with immune infiltration, suggesting it as a potential therapeutic target in cancer immunotherapy. This study underscores the need for further research on SMARCAL1 to enhance immunotherapeutic strategies.

Keywords: Glioma; Immunotherapy; Integrative analysis; Pan-cancer; SMARCAL1.


Conflict of interest statement

Declarations. Competing interests: The authors declare no competing interests.

Figures

Fig. 1
Fig. 1
Expression levels and localization of SMARCAL1. (A) Expression levels of SMARCAL1 in tumor cell lines based on CCLE datasets. (B) SMARCAL1 mRNA expression in TCGA and GTEx datasets comparing cancers to normal tissues. (C) The expression of SMARCAL1 in Glioma tissues compared to normal tissues from HPA datasets. (D) Subcellular localization of SMARCAL1 in HDLM-2, HEK293, and U2OS cells from HPA datasets. ns, p ≥ 0.05; *p < 0.05; **p < 0.01; ***p < 0.001.
Fig. 2
Fig. 2
The prognostic role of SMARCAL1 in human pan-cancer. (A) OS curves using the Kaplan–Meier approach that contrast high and low expression of SMARCAL1 in various cancer types. (B) ROC curve analysis reveals the pan-cancer diagnostic capability of SMARCAL1.
Fig. 3
Fig. 3
Relationship between the clinicopathological features of Gliomas and SMARCAL1. (A) The distribution of clinicopathological characteristics associated with SMARCAL1 in Gliomas within the The Cancer Genome Atlas (TCGA) database. (B) The distribution of clinicopathological characteristics associated with SMARCAL1 in Gliomas within the Chinese Glioma Genome Atlas (CGGA) 325 database. (C,G) The TCGA and CGGA 325 datasets showed a substantial increase in SMARCAL1 in higher-grade Gliomas. One-way ANOVA was used to determine the significance of the difference. (D,H) The TCGA and CGGA 325 datasets showed a substantial increase in SMARCAL1 in Gliomas without an isocitrate dehydrogenase (IDH) mutation. An unpaired t-test was used to determine the difference’s significance. (E,I) In the TCGA and CGGA 325 datasets, SMARCAL1 was markedly elevated in Gliomas without 1p/19q codeletion. An unpaired t-test was used to determine the difference’s significance. (F,J) Increased levels of SMARCAL1 were observed in unmethylated Gliomas with the O6-methylguanine-DNA methyltransferase (MGMT) promoter. Unlike the CGGA 325 database, the TCGA database showed statistical significance for this difference. An unpaired t-test was used to determine the difference’s significance.
Fig. 4
Fig. 4
Examining the methylation of DNA in SMARCAL1. (AV) SMARCAL1 promoter methylation level in tumor and normal tissues across 22 cancer types from UALCAN.
Fig. 5
Fig. 5
Genetic alteration analysis of SMARCAL1. (A) The frequency of changes associated with SMARCAL1 mutation types in various cancer types. (B) Pan-cancer tissues’ mRNA expression of SMARCAL1 putative copy-number alteration (CAN). (C) The top 30 genes in the The Cancer Genome Atlas (TCGA) database that have the highest frequency of mutations in the low SMARCAL1 expression group and the high SMARCAL1 expression group of Gliomas.
Fig. 6
Fig. 6
Tumor infiltration analysis of SMARCAL1. (A) Relationship between the expression of SMARCAL1 and 28 immune cell types that infiltrate tumors in Gliomas found in The Cancer Genome Atlas (TCGA) database. (B) Type 2 T helper cell, Activated CD4 T cell, Memory B cell, Central memory CD8 T cell, Gamma delta T cell, Neutrophil, Immature B cell, Regulatory T cell, and Effector memory CD8 T cell were positively connected with SMARCAL1 expression, while CD56bright natural killer cell was negatively correlated. (C) Type 2 T helper cell and Activated CD4 T cell were positively linked with SMARCAL1 expression. (D) StromalScore, ImmuneScore, and ESTIMATEScore of SMARCAL1 high and low expression groups of Gliomas in The Cancer Genome Atlas (TCGA) database. (E) Each Glioma patient’s SMARCAL1 expression and immunological function enrichment scores were displayed in a heatmap within The Cancer Genome Atlas (TCGA) database. The samples were grouped according to SMARCAL1 expression in ascending order. The correlation analysis’s R- and P-values were displayed in the column and line graphs on the right. ns, p ≥ 0.05; *p < 0.05; **p < 0.01; ***p < 0.001.
Fig. 7
Fig. 7
Relationship between SMARCAL1 expression and TMB. (AE) SMARCAL1 expression correlation in The Cancer Genome Atlas (TCGA) database with TMB of Glioma, LUAD, LIHC, KIRC, and UCEC.
Fig. 8
Fig. 8
Correlation analysis of SMARACL1 expression with Immune Checkpoints across different cancer types. (A) The correlation between SMARACL1 expression and immune checkpoints of Gliomas in the The Cancer Genome Atlas (TCGA) database. (B) The correlation between SMARACL1 expression and immune checkpoints of LUAD in the The Cancer Genome Atlas (TCGA) database.
Fig. 9
Fig. 9
Comparative analysis of ips-ctla4-pd1 in Low and High SMARCAL1 expression groups across various cancer types. (AD) Variations in ips-ctla4-pd1 between the Glioma Low-SMARCAL1 and High-SMARCAL1 groups. (EH) Variations in ips-ctla4-pd1 between the LUAD Low-SMARCAL1 and High-SMARCAL1 groups. (IL) Variations in ips-ctla4-pd1 between the LIHC Low-SMARCAL1 and High-SMARCAL1 groups. (MP) Variations in ips-ctla4-pd1 between the KIRC Low-SMARCAL1 and High-SMARCAL1 groups. (QT) Variations in ips-ctla4-pd1 between the UCEC Low-SMARCAL1 and High-SMARCAL1 groups.
Fig. 10
Fig. 10
Functional analysis of SMARCAL1 expression across diverse tumor types. (AC) Biological processes (BP), (DF) cellular components (CC) and (GI) molecular functions (MF) are mostly related to SMARCAL1 of Gliomas, LUAD, and LIHC in the The Cancer Genome Atlas (TCGA) database. (JL) Kyoto Encyclopedia of Genes and Genomes (KEGG) pathway analysis of SMARCAL11 of Gliomas, LUAD, and LIHC in the The Cancer Genome Atlas (TCGA) database.
Fig. 11
Fig. 11
Drug sensitivity analysis of SMARCAL1 expression. The expression of SMARCAL1 was associated with the sensitivity of SNX-2112 (A), Ruxolitinib (B), KIN001-244 (C), BIX02189 (D), KIN001-266 (E), YM201636 (F), Foretinib (G), Tipifarnib (H), GSK1904529A (I), PD-0332991 (J), QL-XII-61 (K) and 5-Fluorouracil (L).
Fig. 12
Fig. 12
SMARCAL1 and CD276 mRNA and protein expression levels. The levels of SMARCAL1 (A) and CD276 (B) mRNA expression. The levels of SMARCAL1 and CD276 (C) protein expression in Glioma cell lines and astrocyte cell line. The levels of SMARCAL1 and CD276 (D,E) protein expression after SMARCAL1 knockdown in U87-MG and A172 cell lines, respectively.

References

    1. Siegel, R. L., Miller, K. D. & Jemal, A. Cancer statistics, 2020. CA Cancer J. Clin.70(1), 7–30 (2020). - PubMed
    1. Sung, H. et al. Global Cancer Statistics 2020: GLOBOCAN estimates of incidence and mortality worldwide for 36 cancers in 185 countries. CA Cancer J. Clin.71(3), 209–249 (2021). - PubMed
    1. Baig, M. H. et al. Enzyme targeting strategies for prevention and treatment of cancer: Implications for cancer therapy. Semin. Cancer Biol.56, 1–11 (2019). - PubMed
    1. Balça-Silva, J. et al. Cellular and molecular mechanisms of glioblastoma malignancy: Implications in resistance and therapeutic strategies. Semin. Cancer Biol.58, 130–141 (2019). - PubMed
    1. Postow, M. A., Callahan, M. K. & Wolchok, J. D. Immune checkpoint blockade in cancer therapy. J. Clin. Oncol.33(17), 1974–1982 (2015). - PMC - PubMed

LinkOut - more resources