. 2025 May;24(5):794-803.
doi: 10.1038/s41563-024-02115-4. Epub 2025 Feb 24.

On-patient medical record and mRNA therapeutics using intradermal microneedles

Affiliations

On-patient medical record and mRNA therapeutics using intradermal microneedles

Jooli Han et al. Nat Mater. 2025 May.

Abstract

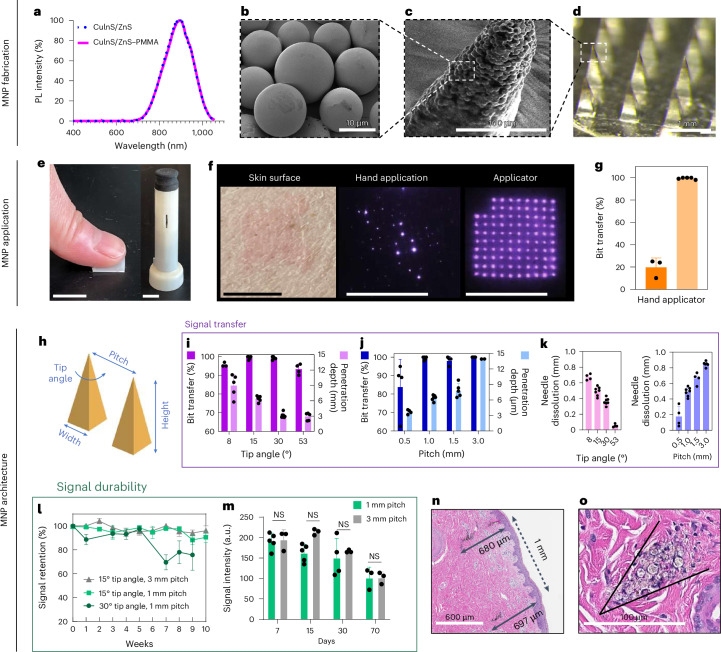
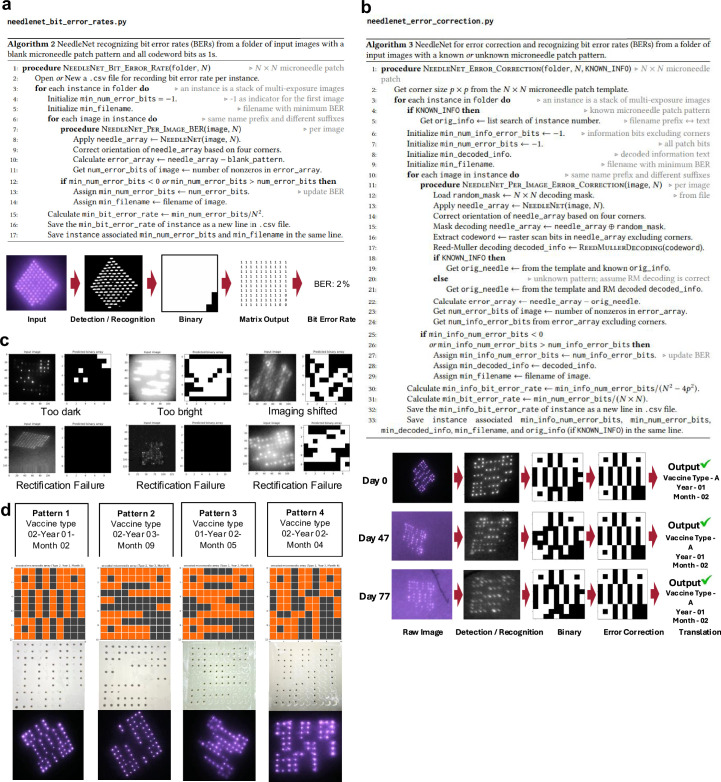
Medical interventions often require timed series of doses, thus necessitating accurate medical record-keeping. In many global settings, these records are unreliable or unavailable at the point of care, leading to less effective treatments or disease prevention. Here we present an invisible-to-the-naked-eye on-patient medical record-keeping technology that accurately stores medical information in the patient skin as part of microneedles that are used for intradermal therapeutics. We optimize the microneedle design for both a reliable delivery of messenger RNA (mRNA) therapeutics and the near-infrared fluorescent microparticles that encode the on-patient medical record-keeping. Deep learning-based image processing enables encoding and decoding of the information with excellent temporal and spatial robustness. Long-term studies in a swine model demonstrate the safety, efficacy and reliability of this approach for the co-delivery of on-patient medical record-keeping and the mRNA vaccine encoding severe acute respiratory syndrome coronavirus 2 (SARS-CoV-2). This technology could help healthcare workers make informed decisions in circumstances where reliable record-keeping is unavailable, thus contributing to global healthcare equity.


Conflict of interest statement

Competing interests: R.L. is a founder and board member of Moderna. A list of entities with which R.L. is involved, compensated or uncompensated, is in Supplementary Note 1. A list of entities with which A.J. is involved, or has been recently involved, compensated or uncompensated, is in Supplementary Note 2. The other authors declare no competing interests.

Figures

Fig. 1
Fig. 1. Schematic of the OPMR technology used for medical information record-keeping.
a, NIR fluorescent QD dye encapsulated in PMMA microparticles (black component of the needle tip) is co-loaded with mRNA encapsulated in LNPs (light blue component of the needle tip) into microneedles that are held intact by a dissolvable polymer backing. Upon MNP application, dye microparticles are deposited into the dermis layer in a predefined pattern that encodes medical information, while mRNA-LNPs are uptaken by immune cells, inducing immunogenicity. NIR patterns are imaged and processed for medical information retrieval on a screen. b, The deep learning (DL)-assisted OPMR technology offers a large encoding capacity in the 106 to 109 range by leveraging the binary feature of OPMR microneedle bits, making the technology applicable to the fast-growing number of mRNA therapeutics currently under development.
Fig. 2
Fig. 2. MNP materials, design and application for effective OPMR delivery.
a, Normalized photoluminescence (PL) intensity of CuInS2/ZnS QD that peaks at 897 nm with or without PMMA encapsulation. b, SEM image of PMMA microparticles with QD nanocrystals encapsulated within. (SEM repeated twice.) c, SEM image of a single microneedle tip loaded with QD–PMMA microparticles. (SEM performed once.) d, Optical image of a MNP loaded with QD–PMMA microparticles at the needle tips. (Optical imaging repeated >30 times.) e, Photo of MNP applications by hand and with a spring applicator. Scale bars, 1 cm. f, The OPMR MNPs do not leave visible footprints; better NIR bit transfer is exhibited with an applicator, as shown in the photos. Scale bars, 1 cm. g, Data showing that better NIR bit transfer is achieved with an applicator; n ≥ 3. It was done with biological replicates of 3–5 animals. h, MNP architecture variables that can affect OPMR quality. i, Bit transfer and skin penetration depth evaluated for different needle tip angles; n ≥ 4, biological, s.d. j, Bit transfer and skin penetration depth evaluated for different pitches; n ≥ 4, biological, s.d. k, Needle dissolution evaluated for different tip angles and pitches; n ≥ 4, biological, s.d. (Experiments in ek were performed in ex vivo pig skin.) l, Signal retention of different MNP architectures over ten weeks; n ≥ 4, biological, s.d. m, Signal intensities of applied MNPs with 1 mm and 3 mm pitches for 70 days; n ≥ 3, biological, s.d.; NS, not significant. n,o, Representative histology image of two bits (n; histology imaging repeated >30 times) and of spherical QD–PMMA microparticles (o) deposited well within the dermis of pig skin. (Experiments in lo were performed in vivo in Yorkshire pigs). o, The black arrow in the figure highlights where a microneedle tip was inserted and left a trace of quantum dot microparticles.
Fig. 3
Fig. 3. Deep learning-based networks allow parameter-free encoding and decoding of the OPMR.
a, Examples of medical information that can be encoded on an OPMR MNP. b, Information data are converted to an encoded binary string before ECC. c, Binary information data are encoded following a 2D template. d, The 2D array becomes an encoded pattern. e, An encryption mask is applied for patient privacy. f, The encrypted pattern is generated for MNP encoding. g, Encoded MNP is fabricated. h, Decoding phase begins with raw image acquisition. i, Raw image is initially rectified via a deep learning-based rectification network. j, Rectified image is in a black-and-white square format. k, Bits are recognized by a deep learning-based recognition network. l, Recognition network outputs a binary array. m, Encryption step is reversed by removing the encryption mask. n, Error bits are identified. o, Error bits are corrected. p, Encoded binary string is translated back to the original information and output on a screen. q, Signal retention analysis quantifies the number of detected NIR bits for 96-bit MNPs. r, Pattern decodability analysis decodes patterned MNPs and evaluates whether they were decoded successfully or not.
Fig. 4
Fig. 4. Long-term efficacy of OPMR in a swine model.
a, MNPs were applied on the flank area of Yorkshire pigs. b, OPMR dyes deposited in the pig skin are invisible to the naked eye. Scale bars, 5 mm. c, NIR signals of 96-bit MNPs remain detectable for three months in pigs. Scale bars, 2 mm. d, NIR signals of patterned MNPs remain decodable for three months in pigs. Scale bars, 2 mm. e, NIR signal retention of 98.44% at 12 weeks in pigs; n = 24 MNPs across seven pigs. f, Machine learning (ML)-based custom image processing system outperforms adaptive threshold (AT) algorithm; n = 20, s.d. g, A 100% information decoding success rate occurred for 12 weeks in pigs; n = 21 MNPs across three pigs. h, Pig weights more than doubled during the three-month monitoring period. i, Histopathological scoring of pig skin with no treatment and with MNPs loaded with polymer only, PMMA microparticles and QD–PMMA microparticles; n = 4–6 MNPs per group, six slides per MNP. (Untreated skin and QD–PMMA MNPs had n = 5 biological replicates; the blank PMMA MNP and polymer-only MNP had n = 4 biological replicates; six tissue samples per biological replicate, s.d.) j, Histopathological scoring of untreated pig skin and pig skin with QD–PMMA MNP applied, at 3, 30 and 70 days after application; n = 3 MNPs per group, six slides per MNP. (Untreated skin, 3 days and 30 days had n = 3 biological replicates; 70 days had n = 4 biological replicates; six tissue samples per biological replicate, s.d.) k, Cumulative histopathological scoring shows a brief increase for the QD–PMMA MNP group that decreases over time (dotted line shows the maximum total score of 18). (Untreated skin, 3 days and 30 days had n = 3 biological replicates; 70 days had n = 4 biological replicates; six tissue samples per biological replicate. One-way analysis of variance (ANOVA); confidence interval, 95%).
Fig. 5
Fig. 5. MNPs that co-deliver the OPMR and potent mRNA vaccine successfully record information and induce immunogenicity in rats.
a, Prime and booster doses were applied on days 0 and 28, respectively, with OPMR–mRNA MNPs to assess the co-delivery of OPMR and mRNA. b, Optical image of a 10 × 10 patterned OPMR MNP and its NIR footprint in rats over 180 days. Scale bars, 2 mm. c, Optical image of a 17 × 17 patterned OPMR MNP and its NIR footprint in rats over 180 days. Scale bars, 2 mm. d, All patterns exhibited a correctable number of error bits and were successfully decoded. e, All three groups (10 × 10 patterned OPMR MNP, 10 × 10 patterned OPMR–mRNA MNP and 17 × 17 patterned OPMR MNP) were successfully decoded over six months; n = 5–6. f, Cryo-TEM images of vaccine solution show intact, monodispersed mRNA-LNPs with and without OPMR dye. (TEM performed once.) g, DLS analysis shows comparable LNP sizes with and without OPMR dye; n = 3. h, Fragment analyser analysis shows comparable mRNA integrities with and without OPMR dye; n = 3. i, Ribogreen assay shows comparable mRNA encapsulation efficiencies with and without OPMR dye; n = 5. j, IM control group, mRNA MNP group and mRNA–OPMR MNP group induce comparable IgG titre levels in rats; n = 6. k, IM control group, mRNA MNP group and mRNA–OPMR MNP group induce comparable post-boost pseudovirus neutralizing antibody (NAb) titre levels in rats. Naive rat response is shown as a dashed line; n = 6. l, OPMR–mRNA MNPs encoding luciferase were stored at room temperature for three months and applied to rats for a shelf-life study, and their luciferase expressions were quantified using an in vivo imaging system. Red circles are selected regions of interest (ROI) to measure the radiance. m, Luciferase expressions of MNPs stored for one month and three months are comparable with those of fresh patches; n = 5. NT50, levels of 50% neutralizing titer.
Extended Data Fig. 1
Extended Data Fig. 1. NIR QD microneedle-based on-patient medical recordkeeping (OPMR) system.
(a) OPMR dye, once deposited in the skin, can be detected by a custom-made handheld NIR imaging system. USB-connected NIR fluorescence imaging system involving a custom LED module emits shorter-wavelength NIR light at 780 nm and a USB-connected camera module that captures the excited QD fluorescence image at longer-wavelength NIR light at >850 nm. (b) Android smartphone with a custom-developed phone application ‘IR Record’ is optimized to capture the OPMR NIR dye signal and saves images. (c) The software takes 30 consecutive images with six different exposure and five different gain settings. This bracket scanning method allows capturing of NIR signals with varying intensities over time. Among the 30 images, one image with the best reading results gets automatically chosen and processed. (d) This OPMR system can be co-loaded with mRNA therapeutics for cancer, infectious, genetic, metabolic, cardiovascular, and neurodevelopmental diseases, and more currently under development from around the globe. The open reading frame (ORF) region of mRNA strands makes the technology easily applicable for a variety of diseases. (e) Schematic of MNP fabrication process. i. QD-PMMA solution is dispensed on top of a PDMS negative mold, which is made with a custom-designed metal master mold. ii. QD-PMMA microparticles are concentrated at the needle tips either by centrifugation or application of vacuum beneath the PDMS mold. iii. The PVP-PVA polymer blend solution is dispensed on top of the PDMS mold to fill the rest of the needles. iv. The polymer solution enters the needle cavities via centrifugation or application of vacuum and form needles and a thin layer of backing for the MNP hold to microneedles intact. v. Once the polymer dries, a Delrin backing is attached on the patch and the patch is removed vertically from the PDMS mold.
Extended Data Fig. 2
Extended Data Fig. 2. Evaluation of MNP application with different applicators and MNP architectures.
(a) MNPs were applied to ex vivo pig skin by hand (left), commercial (Micropoint, Shenzhen, China) (middle) and custom spring-loaded applicators (right). (b) NIR images of MNPs with two different needle tip angles show that bits are better transferred when applied with an applicator than by hand. (c) Histological imaging of pig skin where MNPs did not penetrate more than 250 μm in depth, with hand application, leaving most of the dyes deposited near the epidermis layer, Imaging was performed >30 times. (d) In vivo NIR images of shallowly applied MNPs on day 0 and day 36 post-application in pigs demonstrated a dramatic decrease after 1 month, leading to the assumption that they are shed off with the top layer of the epidermis and that a deeper deposition of the dye can lead to a longer NIR signal durability. (e) The Micropoint and five custom-designed spring-loaded applicators with tunable impact velocities and holding pressures were tested for MNPs with two different tip angles. (f) Applicators were tested on pig skin (left). After the application, tissue was fixed in formalin and embedded in paraffin for cross-sectional evaluation of the maximum needle penetration and dye deposition depths (middle). Furthermore, parts of the skin tissue were frozen and fixed in Optimal Cutting Temperature compound for cross-sectional imaging to detect the presence of the NIR bits in the dermis, showing penetration of a 10-needle array (right). (g) NIR bit transfer and needle dissolution results for 2 different needle tip angles and for different application parameters (needles have 1.5 mm height, 0.4 mm base and 1 mm pitch), n = >4, biological, S.D. (h) Four different microneedle tip angles were tested for MNP architecture optimization, n = >5, biological. (i) Four different pitches, 0.5 mm, 1 mm, 1.5 mm, and 3 mm, were tested for MNP architecture optimization. (j) For needles with 8° tip angle, the dye does not reach the very ends of the needle tips (pointed out with yellow arrows), and the needles are more prone to breakage upon removal from the PDMS negative mold because of their thin structures at the tips (pointed out with blue arrows). (k) To assess the mechanical robustness of the MNP upon skin penetration, we performed mechanical compression tests on 10×10 patterned MNPs (n = 5) using Instron 5943 (Norwood, MA). Microneedles must pierce the stratum corneum without rupturing or bending for proper skin penetration (https://link.springer.com/article/10.1007/s40820-021-00611-9). The pressure required to puncture human skin is known to be roughly 100 psi, which is equivalent to 0.689 MPa (https://pubmed.ncbi.nlm.nih.gov/1757138/). Therefore, the minimum force required to puncture human skin with our patterned MNP (roughly 50 microneedles with the needle base dimension of 400 µm x 400 µm) is 5.512 N (Eq. 1), which means one microneedle patch needs to endure minimum of 5.512 N of compression force to pierce human skin. Fmin = P x Amax = (6.89 × 10⁵ N/m2) * (8 *10−6 m2) = 5.512 N (Eq. 1). With Instron 5943, the microneedle patches were compressed at a rate of 5 mm/min, and the maximum load, load at break, and Young’s modulus were measured with Instron static load cell (±500 N) and Instron Bluehill 3 software. For all patches, the compression force measurements reached the upper limit of the load cell (500 N) before the platens reached the base of the needles, indicating that our microneedle patch can endure more than 500 N, easily exceeding the minimum force to endure for human skin penetration.
Extended Data Fig. 3
Extended Data Fig. 3. Adaptive threshold for NIR signal analysis.
(a) The number of NIR bits were counted using ImageJ (National Institutes of Health, USA) and adaptive threshold method for NIR signal retention analysis. The results were used for MNP architecture optimization. (b) The brightness of NIR bits were computed using ImageJ and adaptive threshold method for NIR signal intensity analysis. The results were used for MNP architecture optimization. (c) Application of an MNP on swine using a custom applicator. (d) Applied MNP footprint was imaged with a custom NIR imaging system and analyzed with adaptive threshold algorithms.
Extended Data Fig. 4
Extended Data Fig. 4. Encoding and decoding of medical information on MNP.
(a) During the encoding phase, information data is converted to a pattern that can be encoded on a MNP. Encoding phase compensates for the loss of individual bits of a microneedle patch over time and ensures error correction up to a certain percentage of bit corruption. Once the type of information data to be recorded is determined, it is translated to a binary string and then to information bits. Since the system is prone to unforeseeable errors such as missing bits from environmental trauma, temporal decay of fluorescent dye, and false positive signal from background noise, redundancy is added to the information bits using Reed-Muller error correcting code. Then, the generated string is mapped to a 2D pattern that fits in a template with four corners reserved for orientation. Encoding bits are arranged sequentially from top left to bottom right to generate an initial encoded pattern. An encryption mask is also added to ensure the privacy of personal medical data. (b) Decoding phase correctly translates acquired raw image back to the medical information that was originally recorded on patients during encoding phase. Decoding phase takes potential spatial imperfectness into consideration and makes a robust image recognition system based on deep learning (DL). Raw image is binarized using a DL-based image binarization network. Raw RGB image is converted to a BnW binary image, rectified to an axis-aligned and upright square geometry, and cropped and rotated to identify the MNP region by finding a minimum area rectangle. It is then fed into a DL-based image recognition network. The recognized binary array is re-oriented, and encryption step is reversed. Array is remapped into binary units for the Reed-Muller error correction decoding step and converted back to the corresponding string. Finally, it is translated back to the corresponding medical information text and is retrieved on a screen. (c) RM ECC adds redundancy to information bits so the transmitted message can be accurately recovered even when some bits are erroneously flipped. RM ECC corrects independent, non-block-based binary bits and is a good option for the OPMR system because spatial correlation between individual microneedle bits cannot be assumed for OPMR MNPs, and this would ensure a reliable long-term data retrieval. (d) Adding a known and fixed encryption pattern ensures the privacy of personal medical data of the OPMR system. i. The number of orientation bits are determined by subtracting encoding bits as per RM code from the total number of bits on an MNP. The orientation bits are allocated at four corners of the MNP with the bottom right corner OFF. ii. A pattern is first generated as a 2D array with roughly half ON-bits and half OFF-bits. iii. An encryption mask is added to the initially generated pattern. iv. After randomly flipping pixels on the raw encoded pattern, the encrypted pattern will consist of half ON and OFF pixels on average, which makes the recognition system robust to any patterns during the decoding step.
Extended Data Fig. 5
Extended Data Fig. 5. Deep learning networks for image binarization, rectification, and generation.
(a) Image binarization network structure uses a U-Net adapted from an off-the-shelf Convolutional Neural Networks (CNN) for Biomedical Image Segmentation,. This is an image-based ConvNet, which is light and fairly accurate and easier to train with a certain amount of training examples. (DoubleConv: double convolutional layers; BN: batch normalization; ReLU: Rectified Linear Unit as the nonlinear activation function; and Skip connection: input or outputs from previous layers directly copied and then stacked as the input of current layer.) (b) 2D array region is rotated, cropped and resized a target size after the binarization step and before the rectification step. A rectangle with the minimum area that covers all the white bits of the 2D array region is generated. The final crop size is 35% larger than the size of minimum-area rectangle while preserving the center of the rectangle as a reference point. (c) A convolutional neural network (CNN)-based network structure is used for the image recognition model. (Conv: convolutional layer; BN: batch normalization; and ReLU: Rectified Linear Unit as the nonlinear activation function.) (d) RecognitionNet requires the microneedle patch size (NxN) as the input, while BinarizatioNet is independent of the microneedle patch size. (e) 650,000 simulated synthetic and paired train models were constructed for robust recognition network. Simulated fluorescence images were generated with potential image variations in three levels: 1) the quality of microneedles, 2) image acquisition, and 3) camera hardware and software. The previously used rectification network was applied to these synthetic models to output paired results, which were then input to a convolutional neural network (CNN)-based recognition network for it to learn the mapping of rectified images to binary arrays. (f) Examples of synthetic patch images with distortion, rotation, defocusing, motion blur, increased background noise, lowered contrast, and more. (g) The validation performances of the image binarization U-Net and image recognition CNN are 0.9297 and 0.9473, respectively, in terms of Sørensen–Dice coefficient (scale of 0 to 1; higher is better). The left plot shows the validation loss of the image binarization U-Net, and the right plot shows the validation loss of the image recognition CNN. The U-Net (for image binarization) and CNN (for image recognition) models resulted in signal retentions over 98% over 12 weeks with real-world pig images without fine tuning.
Extended Data Fig. 6
Extended Data Fig. 6. MNP signal retention, pattern decodability, and information recognition.
(a) ‘needlenet_bit_error_rates’ code for automatic image processing system is programmed to analyze signal retention for 96-bit MNPs. It quantifyies the number of NIR bits that are preserved and detected for 96-bit MNPs and output the number as ‘signal retention %’. Raw fluorescence RGB image is converted to gray-scale and then to BnW, of which a minimum area rectangle tool rotates, crops, and resizes to a target size for an efficient recognition. Each bit is then recognized as either ON or OFF bits to find the percentage of ON-bits out of the 96 bits that were originally transferred on day 0. It is output as bit error rate, which is convertible to the signal retention %. (b) ‘needlenet_error_correction’ code is programmed to decode patterned MNPs and translate the NIR images of patterned MNPs back to the medical information that was originally encoded. Raw RGB image is converted to greyscale using DL-based binarization networks and cropped and rotated using the minimum area rectangle function. Each bit is recognized as either ON or OFF bit using DL-based recognition networks. Error bits are corrected by the RM ECC, and the corrected pattern is translated to information data. If this retrieved information accurately matches the original information data that was encoded on the MNP, then the pattern is processed as ‘successfully decoded’. (c) Initial challenging cases that were used as a guidance to improve simulations for training a robust image recognition network. Main causes of initial image recognition failure are rectification errors due to severe boundary noise, image distortion, and too large or too small global histogram threshold. Simulated spatial variations (e.g., under- and over- exposure, high background noise, high brightness variances) improved the image recognition network. (d) Four different 10×10 patterns were encoded on MNPs for the signal retention and information preservation evaluations in swine. Random medical information was assigned to each pattern.
Extended Data Fig. 7
Extended Data Fig. 7. Safety evaluation of QD-PMMA loaded MNPs.
(a) The cytotoxicity of the OPMR dye (QD-PMMA) was analyzed using HeLa cells. (n = 3, S.D., cytotoxicity test performed once.) When different concentrations of QD-PMMA microparticles were incubated for 20 hours, there was no effect on the cell growth % (b) The cytotoxicity of the QD-PMMA was also analyzed using adult human dermal fibroblasts that were incubated with QD-PMMA for 20 hours and assessed for toxicity via: Live/Dead assay, which uses green-fluorescent calcein-AM to indicate live cells and red-fluorescent ethidium homodimer-1 to stain dead cells, and the CCK-8 assay, which quantifies the metabolic activity of viable cells. (Scale bar=100 µm) (c) All QD-PMMA concentrations exhibited cell viability above 85%, indicating that the QD-PMMA microparticles are not cytotoxic, n = 5, S.D. (d) Grading criteria used for microscopic lesions seen in histopathological pig skins after MNP applications. (e) Skin sections were retrieved 3, 30, and 70 days post OPMR-MNP application and were processed and stained with hematoxylin and eosin for biocompatibility analyses for histopathological evaluation, showing mild to moderate subacute inflammation in the superficial dermis at day 3 post-application, and this dermatitis was minimal at day 30 and 70 post-application. At day 3 post-application, the dermis at the sites of microneedle injections was often infiltrated by histocytes, eosinophils, neutrophils, and occasional multinucleated foreign body giant cells, scattered around blood vessels. The epidermis at the sites of injections was slightly hyperplastic and/ or hyperkeratotic, containing nucleated keratin flakes, necrotic cellular debris (depicted at day 30 post-application). Groups: untreated skin, 3 days, 30 days, n = 3 biological replicates (samples from 3 different pigs), group 70 days, n = 4 biological replicates (samples from 4 different pigs), 6 tissue samples per biological replicate. (f) Quantification of CC3 staining of pig tissue with no treatment, with MNP applications loaded with just PVA/PVP polymer, blank PMMA microparticles, and QD-PMMA microparticles were applied 3 days prior to skin excision. To study if the OPMR system activates cell apoptotic mechanisms, tissue samples were stained with cleaved caspase-3 (CC3). And quantitative analysis showed no differences in the apoptotic cell % between the control and experimental groups, indicating there was no signal of immunoreactivity in the skin sections. n = 4 biological replicates (samples from 4 different pigs), 6 tissue samples per biological replicate, S.D. (g) To confirm the QD clearance from skin tissue, the zinc (Zn) content in pig skin 7 days and 70 days post OPMR-MNP application was evaluated using inductively coupled plasma optical emission spectrometer (ICP-OES, Agilent ICP-OES 5100 VDV) analysis after excising the tissue and dissolving it in Aqua Regia medium (nitric acid: hydrochloric acid 1:3). As a result, we observed 41 (±12.77) % of QD clearance at 70 days post-application as shown below. This reduction in the measured Zn content was conforming with the amount of signal reduction of the applied patch, which suggests the signal decrease over time is attributed to the QD clearance from the skin tissue. n = 3, biological, S.D.
Extended Data Fig. 8
Extended Data Fig. 8. Fabrication of MNPs with OPMR and mRNA-LNPs.
Vacuum through devices were custom designed and fabricated; (a) Top, (b) middle and (c) bottom layers of the device were designed using 2D CAD modeling. The top and bottom pieces were made by laser cutting 1/8’-thick Acrylic sheets (McMaster-Carr 8589K41), and the middle piece was made by laser cutting 0.045’-thick Acrylic foam adhesive sheet (McMaster-Carr 1630N24). The middle layer was adhered to the top layer first (d), and then the bottom layer was adhered to complete the assembly (e). Patterned MNPs were fabricated either by manually knocking out QD-loaded needles (f) or by selectively loading QDs using a mask (g). These two methods did not make a difference in signal transfer or signal longevity results. Patterned masks can be created by hole-punching or laser-burning during MNP fabrications. Other viable approaches to fabricate patterned MNPs could involve molds that consist of adjustable pins. Once a pattern is generated, a robot could push selected pins to create a positive mold representing the desired pattern in real time. The adjustable pin arrays could also directly press against pre-made full array MNPs to punch out specific needles. (h) Master molds of 20x20 needle arrays are 3D printed for negative PDMS mold fabrication. (i) A patterned mask is placed on top of the PDMS mold. (j) QD-PMMA solution is dispensed on the masked PDMS under vacuum to selectively load the dye into the needle tips in a pattern. (k) The mRNA-LNP-polymer solution is then added to the mold for the mRNA-OPMR MNP fabrication. (l) The footprint of dispensed mRNA-LNP-polymer solution while drying. (m) Once the polymer dries, a Delrin backing is attached to the back of the MNP, and the patch is removed from the PDMS mold to be further dried in a desiccator under vacuum for 48 hours. Once an MNP is applied to the skin, the microneedles are designed to readily dissolve within minutes, simultaneously delivering a clinically relevant dose of mRNA vaccine and an NIR pattern that represents corresponding medical information (e.g., vaccine type, manufacturer, vaccination date) to the dermis layer, producing effective immunogenicity and long-term information recording on patients. (n) Cross-sectional scanning electron microscopy (SEM) images of an OPMR-mRNA-MNP needle near the tip showing the OPMR dye (QD-PMMA microparticles; 10 µm), near the mid-body region where mRNA vaccine solution is loaded and at the backing of the needle where the PVA-PVP material is showing a smooth surface. Imaging was performed once. (o) Co-loaded OPMR-mRNA MNP needles will have OPMR dye concentrated at the needle tips and vaccine loaded in the needle bodies as depicted with pink color dye.
Extended Data Fig. 9
Extended Data Fig. 9. Evaluation of information encoding and decoding with OPMR MNPs.
(a) A 17×17 pattern demonstrates the feasibility of recording billions of different patterns. Eight bits in each corner were assigned for patch orientation. An encrypted pattern was generated for encoding. A mask was fabricated using laser cutting. QD fluorescent dyes were selectively loaded to the PDMS negative mold. Patterned MNP was demolded from mold. The patterned MNP was applied to rats for long-term OPMR evaluations. (b) Encoded information on a microneedle patch can be simple (e.g., vaccine type, manufacturer, LOT/batch number, vaccination year and month), or complex (e.g., drug package inserts, active ingredient, warnings and precautions, prescribing information). Our current strategy of storage uses information bits as indexing numbers to encode 1) medical information by separating 37 bits into blocks, of which each is an index for a piece of information, or 2) unique identifier for each patient, which can cover the entire world’s human population and tens of generations after that with a 1.7 cm x 1.7 cm MNP. We can also use these indexing numbers to look up a library of hundreds of pages of documents. The information to encode can be determined as per use case while maximizing the usage of the on-patient bits. (c) Encodability can potentially be enhanced by utilizing each pattern as a ‘data matrix’, which assigns a serial number per pattern that can be linked to an online page. With the ‘data matrix’ approach, 1.1 trillion different serial numbers can be encoded with a 12 x 12 patch. (d) Five randomly selected representative 17×17 patterns are shown as examples. (e) Application and imaging of MNP on a rat using our custom applicator and imaging system. (f) 17×17 OPMR MNP encoding for ‘35-52-123456-03-08’ was decoded correctly for a 6-month monitoring period. The number of error bits fluctuate over the course of monitoring period due to rat skin irritation, rat fur interfering with the signal, and other environmental factors, but these error bits are successfully corrected with RM ECC.
Extended Data Fig. 10
Extended Data Fig. 10. Co-delivery of OPMR and mRNA-LNP vaccine encoding for SARS-CoV-2.
(a) Cryo-TEM images of vaccine solution show intact, well-dispersed mRNA-LNPs with (i) and without (ii) the OPMR dye (TEM performed once). DLS analysis show comparable Z-averages of mRNA-LNPs with (iii) and without (iv) the OPMR dye (DLS performed for 3 replicates). (b) 96-bit MNPs and patterned MNPs were applied to light-colored porcine skin and dark-colored human cadaveric skin to assess potential light absorbance, they exhibited comparable BER of 0-1 %, and successful pattern decodability. This demonstrates that the pigment of skin does not substantially affect OPMR performance. (c) OPMR performance with obstructed viewing of the pattern due to hair coverage was tested to assess potential suboptimal results. NIR signals penetrated through, resulting in successful pattern imaging and decoding. (d) Regarding potential complications arising from patterns that are overlapped or in close proximity, a ‘bounding box’ feature can help the object detection module. Object detection module easily detects pattern without an additional bounding box, but reserving the outer-most edges of patterns will facilitate ‘minimum square area’ cropping for pattern isolation and detection. (e) Quenching of QD-PMMA and shelf-life of mRNA-OPMR MNP were quantified in different settings. Signal brightness of 1) unencapsulated QD particles, 2) 10 µm size QD-PMMA particles, and 3) 200 µm size QD-PMMA particles in PBS in Eppendorf tubes, 4) 10 µm size QD-PMMA particles and 5) 200 µm size QD-PMMA particles in a live pig’s dermis layer, and 6) 200 µm size QD-PMMA particles in a live rat’s dermis layer were assessed for 70 days. As a result, all the in vitro groups and in vivo rat group exhibited no reduction in QD signal brightness, whereas the in vivo pig groups including the MNP applied groups exhibited a gradual signal reduction over time. This signifies that the signal reduction over time is caused by the QD clearance from the skin tissue rather than quenching. (f) Signal brightness of 10 µm size OPMR dye in PBS in Eppendorf tubes in a dark incubator was quantified, when exposed to natural sunlight, and when directly exposed to UV light-only (UVP CL-1000 Ultraviolet Crosslinker, 365 nm) for 250 days. The signal brightness of QD particles remained unchanged for the dark oven group, was reduced by 18.85 % for the natural sunlight group, and was reduced by 98.27 % for the UV chamber group. This signifies that quenching is most affected by the UV exposure. (g) SARS-CoV-2 RBD mRNA-OPMR MNPs were applied after being stored in a desiccator at RT for 3 months. Rats were primed with an IM injection of 10 μg of fresh mRNA-LNPs soluble and boosted with the 3-month stored MNPs (n = 5, S.D.), and there was no notable difference compared to fresh soluble primed and fresh soluble boosted group (n = 6, S.D.). These results showcase a promising shelf-life of mRNA-LNP-OPMR MNPs. (h) The advantages of the OPMR technology is summarized in a table. Comparisons between microchips, phones, online databases, paper vaccine cards, and OPMR are detailed.

References

    1. Qin, S. mRNA-based therapeutics: powerful and versatile tools to combat diseases. Signal Transduct. Target. Ther.7, 166 (2022). - PMC - PubMed
    1. Bhat, B. mRNA therapeutics: beyond vaccine applications. Trends Mol. Med.27, 923–924 (2021). - PubMed
    1. Barbier, A. J. The clinical progress of mRNA vaccines and. Nat. Biotechnol.40, 840–854 (2022). - PubMed
    1. Beck, J. D. mRNA therapeutics in cancer. Mol. Cancer20, 69 (2021). - PMC - PubMed
    1. Deng, Z. mRNA vaccines: the dawn of a new era of cancer immunotherapy. Front. Immunol.13, 887125 (2022). - PMC - PubMed

LinkOut - more resources