. 2025 Aug;30(8):3393-3403.
doi: 10.1038/s41380-025-02927-z. Epub 2025 Feb 24.

Polygenic scores for autism are associated with reduced neurite density in adults and children from the general population

Collaborators, Affiliations

Polygenic scores for autism are associated with reduced neurite density in adults and children from the general population

Yuanjun Gu et al. Mol Psychiatry. 2025 Aug.

Abstract

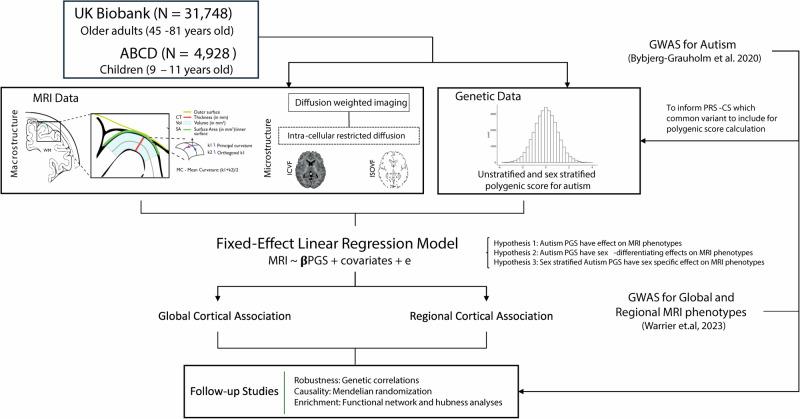
Genetic variants linked to autism are thought to change cognition and behaviour by altering the structure and function of the brain. Although a substantial body of literature has identified structural brain differences in autism, it is unknown whether autism-associated common genetic variants are linked to changes in cortical macro- and micro-structure. We investigated this using neuroimaging and genetic data from adults (UK Biobank, N = 31,748) and children (ABCD, N = 4928). Using polygenic scores and genetic correlations we observe a robust negative association between common variants for autism and a magnetic resonance imaging derived phenotype for neurite density (intracellular volume fraction) in the general population. This result is consistent across both children and adults, in both the cortex and in white matter tracts, and confirmed using polygenic scores and genetic correlations. There were no sex differences in this association. Mendelian randomisation analyses provide no evidence for a causal relationship between autism and intracellular volume fraction, although this should be revisited using better powered instruments. Overall, this study provides evidence for shared common variant genetics between autism and cortical neurite density.


Conflict of interest statement

Ethics approval and consent: All methods were performed in accordance with the relevant guidelines and regulations. Ethical approval to access deidentified data from the UK Biobank and ABCD was obtained from the Human Biology Research Ethics Committee, University of Cambridge (Cambridge, UK) (HBREC.2020.07). Informed consent was provided by all participants. Competing interests: The authors declare no competing interests.

Figures

Fig. 1
Fig. 1. Schematic summary.
We generated polygenic scores for autism in two datasets - UK Biobank and ABCD and investigated the associations between the polygenic scores and five brain structural phenotypes globally as well as in 180 regions. We fitted sex-stratified and unstratified models. We confirmed the robustness of the results using genetic correlations and assessed causality using Mendelian randomization. Finally, to contextualise the results, we investigated enrichment of the associations in cortical networks.
Fig. 2
Fig. 2. Statistical and Genetic correlation between polygenic scores for autism and global MRI-derived phenotypes.
A Percentage of variance explained by polygenic score for autism (PGS) for different global cortical MRI-derived phenotypes under cohorts. SA surface area, CT cortical thickness, MC mean curvature, ICVF intracellular volume fraction or neurite density index, ISOVF isotropic volume fraction. Blue bar indicates negative associations, and the red bar indicates positive associations. * p <= 0.05, ** p <= 0.01. B Genetic correlation (rg) between autism and MRI-derived phenotype GWAS. Whiskers indicate 95% confidence intervals. Asterisks indicate p values after FDR<5% correction, with code sign the same as A.
Fig. 3
Fig. 3. Statistical and Genetic correlation between polygenic scores for autism and regional MRI-derived phenotypes.
A Cortical map of regional associations between PGS for autism and cortical MRI-derived phenotypes. Red outline means the effect of PGS for autism reached statistical significance at FDR <=0.05. B Cortical map of regional associations between PGS for autism and cortical MRI-derived phenotypes after global phenotype correction. Red outline means the effect of PGS for autism reached statistical significance at FDR <=0.05. For brevity, we have displayed only regional association maps for phenotypes where there was at least one significant regional association. C Genetic correlation between autism and regional ICVF in regions with statistically significant associations with the PGS for autism. Asterisks indicate p values after FDR correction: * p <= 0.05, ** p <= 0.01, *** p <= 0.001.
Fig. 4
Fig. 4. Enrichment Analysis.
A Correlation plot between genetic hubness and autism PGS association with ICVF in the ABCD and UK Biobank cohorts. B Correlation plot between structural connectivity and autism PGS association with ICVF in the ABCD and UK Biobank cohorts. Each point represents a region and regions where there is a significant association between the phenotype and autism PGS are coloured in red. R is the Pearson correlation coefficient. p is the p value before correction for multiple testing, all p-value remained significant (<0.05) after FDR correction.
Fig. 5
Fig. 5. White matter tract association.
Percentage of variance explained by polygenic score for autism (PGS) for 15 major white matter tracts for ICVF in UKB. Blue bar indicates negative associations, and the red bar indicates positive associations. * p <= 0.05. The acronyms for the 15 major white matter tracts are mcp = middle cerebellar peduncle, ml = medial lemniscus, cst = corticospinal tract, ar = acoustic radiation, atr = anterior thalamic radiation, str = superior thalamic radiation, pts = posterior thalamic radiation, slf = superior longitudinal fasciculus, ilf = inferior longitudinal fasciculus, ifo = inferior fronto-occipital fasciculus, unc = uncinate fasciculus, cgc = cingulate gyrus part of cingulum, cgh = parahippocampal part of cingulum, fmi = forceps minor, and fma = forceps major. Suffix _r means it is estimated from the right hemisphere and _l means it is estimated from the left hemisphere.
Fig. 6
Fig. 6. Percentage of variance explained by sex-specific and sex-differentiating PGS for autism.
A and B Percentage of variance explained by sex stratified autism PGS for the global phenotypes in the equivalent sexes in ABCD and UKB. C Percentage variance explained by the sex interaction analysis. Asterisks indicate P values after FDR correction: * P <= 0.05, ** P <= 0.01. mPGS = polygenic scores from the males-only GWAS, fPGS = polygenic scores from the females-only GWAS, and PGS:Sex = the interaction between sex and PGS. SA = surface area, CT = cortical thickness, MC = mean curvature, ICVF = intracellular volume fraction.

Update of

References

    1. Tick B, Bolton P, Happé F, Rutter M, Rijsdijk F. Heritability of autism spectrum disorders: a meta-analysis of twin studies. J Child Psychol Psychiatry. 2016;57:585–95. - PMC - PubMed
    1. Bai D, Yip BHK, Windham GC, Sourander A, Francis R, Yoffe R, et al. Association of genetic and environmental factors with autism in a 5-country cohort. JAMA Psychiatry. 2019;76:1035–43. - PMC - PubMed
    1. Grove J, Ripke S, Als TD, Mattheisen M, Walters RK, Won H, et al. Identification of common genetic risk variants for autism spectrum disorder. Nat Genet. 2019;51:431–44. - PMC - PubMed
    1. Gaugler T, Klei LL, Sanders SJ, Bodea CA, Goldberg AP, Lee AB, et al. Most genetic risk for autism resides with common variation. Nat Genet. 2014;46:881–5. - PMC - PubMed
    1. Parikshak NN, Swarup V, Belgard TG, Irimia M, Ramaswami G, Gandal MJ, et al. Genome-wide changes in lncRNA, splicing, and regional gene expression patterns in autism. Nature. 2016;540:423–7. - PMC - PubMed

MeSH terms

LinkOut - more resources