A Novel DNA Repair-Gene Model to Predict Responses to Immunotherapy and Prognosis in Patients With EGFR-Mutant Non-Small Cell Lung Cancer
- PMID: 39994841
- PMCID: PMC11850292
- DOI: 10.1111/1759-7714.70025
A Novel DNA Repair-Gene Model to Predict Responses to Immunotherapy and Prognosis in Patients With EGFR-Mutant Non-Small Cell Lung Cancer
Abstract
Background: The epidermal growth factor receptor mutant (EGFRm) non-small cell lung cancer (NSCLC) has a unique "cold" immune profile. DNA damage repair (DDR) genes are closely related to tumorigenesis and the effectiveness of immunotherapy in many tumors. However, the role and mechanism of DDR in the genesis and progression of EGFRm NSCLC remain unclear.
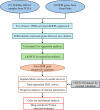
Methods: This study included 101 EGFRm NSCLC samples from The Cancer Genome Atlas (TCGA) dataset and a GSE31210 dataset (external set) from the GEO database. Cluster analysis was used to identify different subtypes of EGFRm NSCLC based on the expression of DDR genes. Univariate and LASSO regression analysis was used to develop a DDR-based predictive model. The prognostic significance of this model was assessed using Cox regression, Kaplan-Meier, and receiver operating characteristic (ROC) curve analyses. Bioinformatics analysis was performed to investigate the clinicopathological characteristics and immune profiles associated with this model. In vitro experiment was performed to testify the role of DDR genes in EGFRm NSCLC.
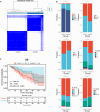
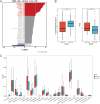
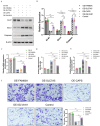
Results: We identified two subtypes of EGFRm NSCLC: DDR-activated and DDR-suppressed. The DDR-activated subtype showed more aggressive clinical behavior and poorer prognosis and was more responsive to immunotherapy. A prognostic model for EGFRm NSCLC was constructed using four DDR genes: CAPS, FAM83A, IGLV8-61, and SLC7A5. The derived risk score could serve as an independent prognostic indicator. High- and low-risk patients exhibited distinct clinicopathological characteristics, immune profiles, and responses to immunotherapy. The T-cell inflammation and Tumor Immune Dysfunction and Exclusion (TIDE) scores differed between the high- and low-risk subgroups, with both showing enhanced effectiveness of immunotherapy in the low-risk subgroup. Targeted therapy such as BI.2536, an inhibitor of polo-like kinase 1, could be effective for patients with high-risk EGFRm NSCLC. Meanwhile, in vitro detection approved the role of DDR genes in EGFRm NSCLC response.
Conclusion: This study demonstrated a diversity of DDR genes in EGFRm NSCLC and developed a predictive model using these genes. This model could assist in identifying potential candidates for immunotherapy and in assessing personalized treatment and prognosis of patients with EGFRm NSCLC.
Keywords: DNA‐damage repair; epidermal growth factor receptor; non‐small cell lung cancer; prognostic model.
© 2025 The Author(s). Thoracic Cancer published by John Wiley & Sons Australia, Ltd.
Conflict of interest statement
Qing Zhou reports honoraria from AstraZeneca, Boehringer Ingelheim, BMS, Eli Lilly, MSD, Pfizer, Roche, and Sanofi, outside the submitted work.
Figures


References
-
- Thai A. A., Solomon B. J., Sequist L. V., Gainor J. F., and Heist R. S., “Lung Cancer,” Lancet 398, no. 10299 (2021): 535–554. - PubMed
-
- Travis W. D., Brambilla E., Nicholson A. G., et al., “The 2015 World Health Organization Classification of Lung Tumors: Impact of Genetic, Clinical and Radiologic Advances Since the 2004 Classification,” Journal of Thoracic Oncology 10, no. 9 (2015): 1243–1260. - PubMed
-
- Li J., Wang J., Chen Y., Yang L., and Chen S., “A Prognostic 4‐Gene Expression Signature for Squamous Cell Lung Carcinoma,” Journal of Cellular Physiology 232, no. 12 (2017): 3702–3713. - PubMed
MeSH terms
Substances
Grants and funding
LinkOut - more resources
Full Text Sources
Medical
Research Materials
Miscellaneous

