. 2025 Apr 1;18(4):235-250.
doi: 10.1158/1940-6207.CAPR-24-0383.

Systemic Inflammation and the Inflammatory Context of the Colonic Microenvironment Are Improved by Urolithin A

Affiliations

Systemic Inflammation and the Inflammatory Context of the Colonic Microenvironment Are Improved by Urolithin A

Marmar R Moussa et al. Cancer Prev Res (Phila). .

Abstract

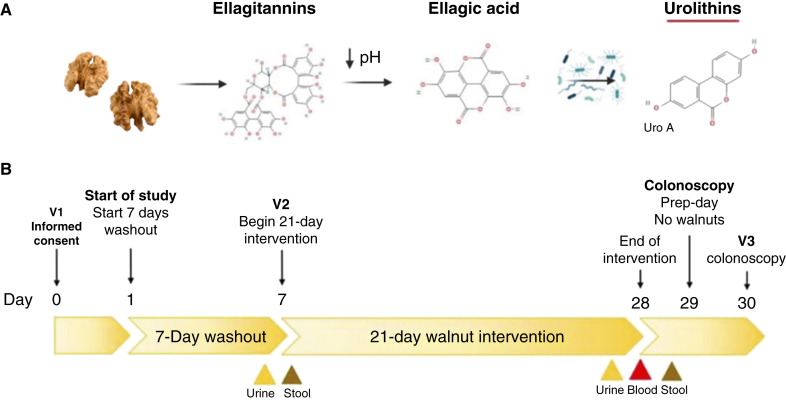
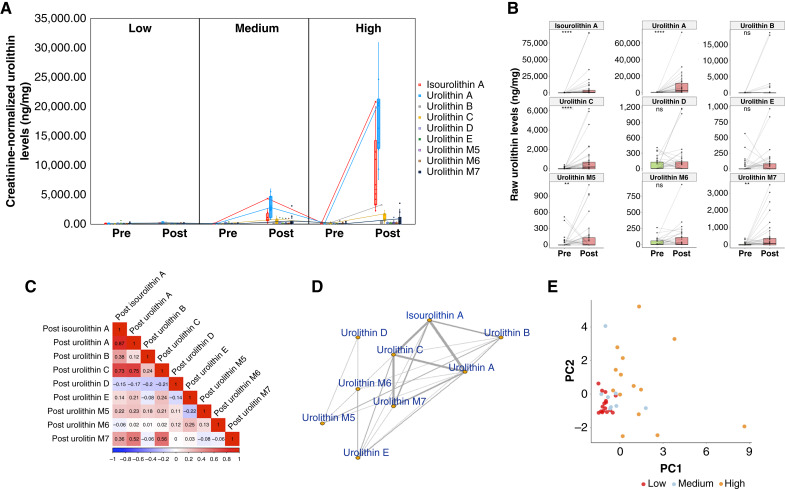
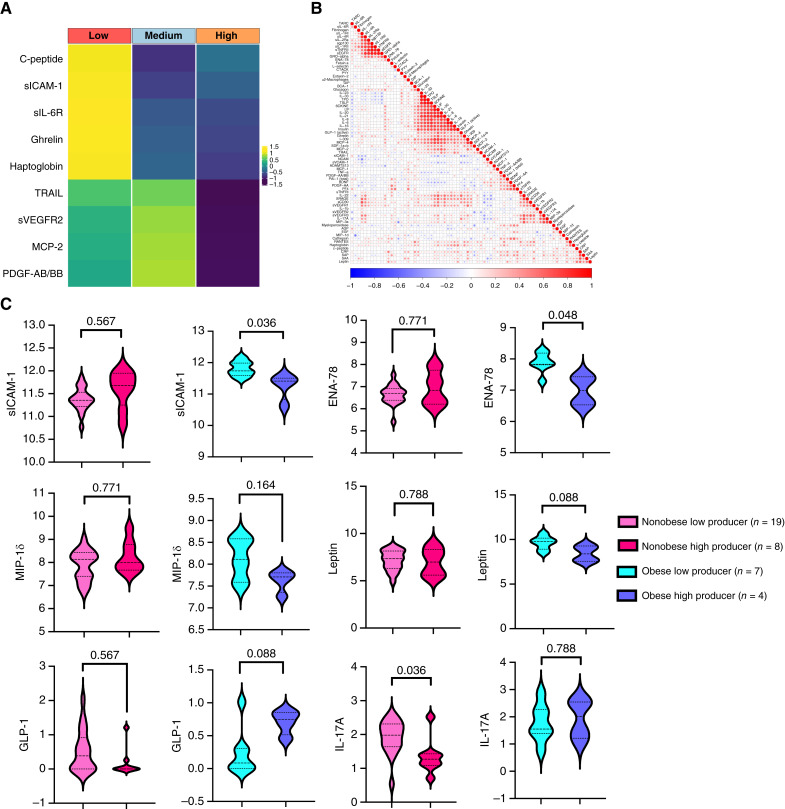
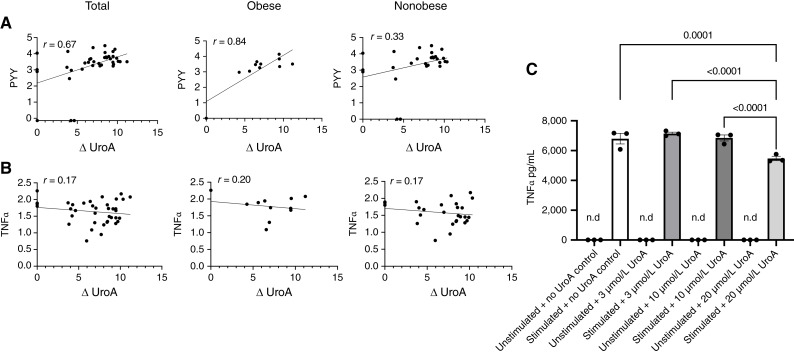
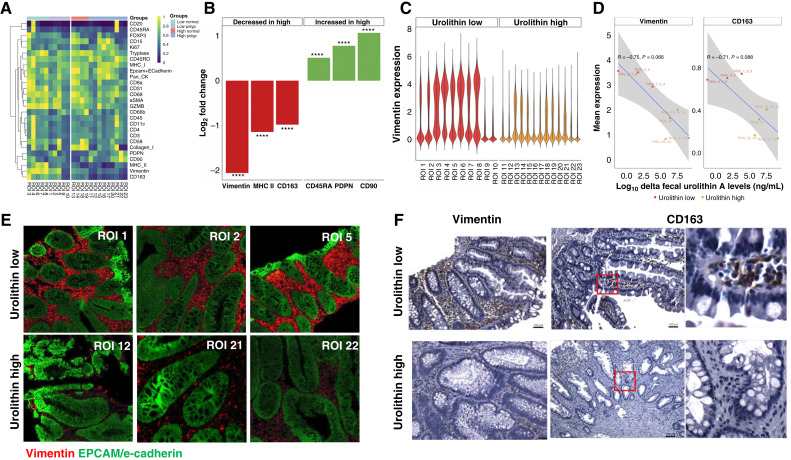
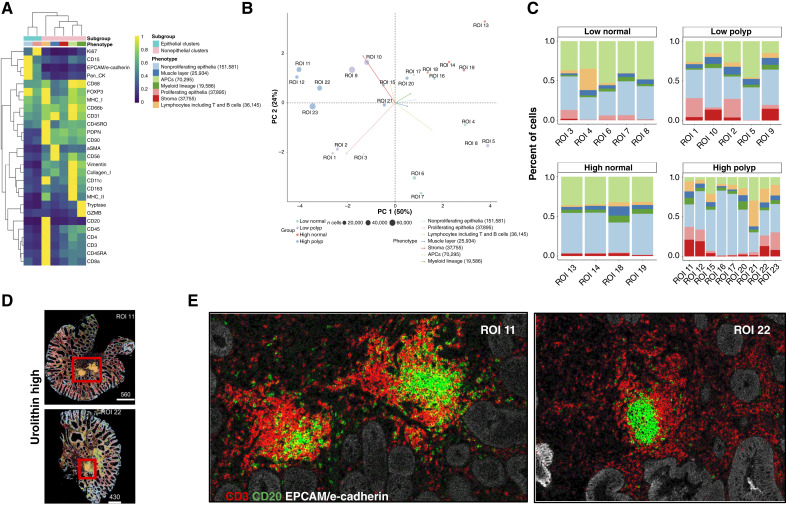
Diet affects cancer risk, and plant-derived polyphenols exhibit cancer-preventive properties. Walnuts are an exceptional source of polyphenolic ellagitannins, converted into urolithins by gut microflora. This clinical study examines the impact of urolithin metabolism on inflammatory markers in blood and colon polyp tissue. We evaluate the effects of walnut consumption on urinary urolithins, serum inflammatory markers, and immune cell markers in polyp tissues obtained from 39 subjects. Together with detailed food frequency data, we perform integrated computational analysis of metabolomic data combined with serum inflammatory markers and spatial imaging of polyp tissues using imaging mass cytometry. LC/MS-MS analyses of urine and fecal samples identify a widely divergent capacity to form nine urolithin metabolites in this patient population. Subjects with higher urolithin A formation exhibit lower levels of several key serologic inflammatory markers, including C-peptide, soluble form of intracellular adhesion molecule 1, sIL-6R, ghrelin, TRAIL, sVEGFR2, platelet-derived growth factor (PDGF), and MCP-2, alterations that are more pronounced in obese individuals for soluble form of intracellular adhesion molecule 1, epithelial neutrophil-activating peptide 78, leptin, glucagon-like peptide 1, and macrophage inflammatory protein 1δ. There is a significant increase in levels of peptide YY associated with urolithin A formation, whereas TNFα levels show an opposite trend, recapitulated in an in vitro system with ionomycin/phorbol 12-myristate 13-acetate-stimulated peripheral blood mononuclear cells (PBMC). Spatial imaging of colon polyp tissues shows altered cell cluster patterns, including a significant reduction of vimentin and CD163 expression associated with urolithin A. The ability to form urolithin A is linked to inflammation, warranting further studies to understand the role of urolithins in cancer prevention. Prevention Relevance: We evaluate cancer-protective effects of walnuts via formation of microbe-derived urolithin A, substantiating their functional benefits on serum inflammatory markers and immunologic composition of polyps in normal/obese subjects. Our approach incorporates personalized nutrition within the context of colonic health, providing the rationale for dietary inclusion of walnut ellagitannins for cancer prevention.


Conflict of interest statement

A. Aksenov reports being a co-founder of Arome Science, Inc. and Bileomix, Inc. V.N. Motta reports other support from Standard BioTools during the conduct of the study, as well as other support from Standard BioTools outside the submitted work. No disclosures were reported by the other authors.

Figures

Figure 1.
Figure 1.
Clinical study design. A, Overview of ellagitannin metabolism after ingestion. B, Overall study design. V, visit; Uro A, urolithin A.
Figure 2.
Figure 2.
Urolithin levels presented as model-based clustering and correlation analysis. A, Distribution of urolithin metabolites detected in the urine before (Pre) and after (Post) walnut consumption. Patients are stratified into three groups based on delta urolithin A levels (low, medium, and high). B, Creatinine-normalized urolithin levels (ng/mg) of each urolithin metabolite measured for each patient before and after walnut consumption. Paired Wilcoxon signed-rank significance codes: ****, <0.0001; ***, <0.0001–0.001; **, <0.001–0.01; ns, >0.05. C, Rank-based Spearman correlation between the individual urolithin metabolites. The strongest correlations can be observed in the urolithin A, isourolithin A, and urolithin C subgroups. D, Urolithin network graph (pathway) as learned from study cohort metabolomic data. The Spearman correlation score was used to create the adjacency matrix for the illustrated graph, in which vertices represent each of the measured urolithin metabolites and edges exist between nodes and vertices, in which the edge weight is ≥0.25 and the edge thickness represents the value of the correlation score. E, Three urolithin metabolism groups/clusters projected on the first two principal components (PC) of the complete urolithin (including all nine metabolites) dataset. The three groups are identified as low (red), medium (light blue), and high (orange) producers based on the delta urolithin A Gaussian mixture model clusters.
Figure 3.
Figure 3.
Blood serum biomarkers and correlation with urolithin A levels. A, Heatmap showing the average normalized levels of log(1 + x)-transformed serum inflammatory markers, clustered by urolithin metabolic groups (low, medium, and high). C-peptide, sICAM-1, sIL-6R, ghrelin, and haptoglobin are each most lowered in the high–urolithin A producers. B, Pairwise rank-based Spearman correlation of serum inflammatory markers shows a total of 73 inflammatory markers that were measured in patient serum at the time of colonoscopy. C, Violin plots show four groups of high (red/blue) and low (pink/light blue) urolithin A producers, stratified by obese (BMI ≥30; n = 12 ) and nonobese (BMI <30; n = 27) subjects. Thick dotted lines indicate the median values, and thin dotted lines indicate upper and lower quartiles. We compared median serum marker levels between low and high urinary urolithin producers, stratified by obese and nonobese subjects. Among obese subjects, median serum inflammatory markers were generally lower for high producers, whereas this trend did not hold for nonobese subjects. Overall, FDR-adjusted P values indicate that these results were significant for sICAM-1 (P = 0.036), IL-17A (P = 0.036), and ENA-78 (P = 0.048). High and low/medium urolithin A producers were classified via Gaussian mixture model–based unbiased modeling, with a median value of 10,987.5 ng/mg for high producers and median value of 703.5 ng/mg for low/medium producers. One patient with a negative value (−144) needed to be assigned a zero value because of log-transformation requirements. All serum markers are reported as ln(x), except for GLP-1 that was log-transformed using ln(x + 1).
Figure 4.
Figure 4.
Examples of positive and negative correlations of selected inflammatory markers with urinary urolithin A levels. A, Peptide YY shows a significant positive correlation with urolithin A (UroA) levels (P = 0.003) in all patients and in BMI-high (P = 0.001) subjects and trending in BMI-normal (P = 0.087) subjects, (B) whereas TNFα shows a trend toward a negative, nonsignificant correlation in both groups. C, Effects of urolithin A on TNFα secretion in ionomycin/PMA-stimulated PBMCs. Urolithin A (3, 10, and 20 μmol/L) was preincubated for 5 hours with PBMCs, followed by 24-hour stimulation with ionomycin/PMA, as described under “Materials and Methods.” Samples were incubated in triplicate, and data were analyzed by one-way ANOVA, followed by Bonferroni for multiple comparisons (mean ± SEM). n.d, not detected; PYY, peptide YY.
Figure 5.
Figure 5.
IMC computational analysis workflow. Schema shows the IMC assay and computational analysis workflow. End-to-end workflow for multiplexed image processing and analysis components. The pipeline includes custom code, DeepCell for segmentation, steinbock for quantification, MCD Viewer and cytomapper for visualization, and SpatialExperiment and SC1 tools for clustering analysis, differential expression analysis, and visualization. (Created using Lucidchart.com.)
Figure 6.
Figure 6.
IMC analysis of polyps. A, Heatmap of averaged expression of each measured marker for each ROI, stratified by urolithin low and high, normal and polyp tissues. B, A total of six markers were found to be differentially expressed between the groups, including vimentin (>−4-fold). Significance codes: ****, <0.0001; ns, >0.05. C, Violin plots of vimentin expression are shown. Expression values were obtained by transforming the raw IMC counts with the inverse hyperbolic sine function (typical of cytometry data). D, Correlations between log delta fecal urolithin A levels for the top and bottom tertiles of the sample group and mean expression levels of vimentin and CD163. E, Representative IMC images of urolithin low and high, highlighting the marked reduction of vimentin in urolithin high. IMC images were visualized using MCD Viewer. F, IHC analysis of vimentin expression in urolithin low (ROI 5, serrated) vs. high (ROI 22, tubular) adenomas. Images were captured using conventional microscopy and QCapture software.
Figure 7.
Figure 7.
Unsupervised clustering analysis. A, Cluster analysis heatmap showing maximum-scaled mean marker expression across all ROIs per cluster showing heterogeneous cell types and distinct tissue co-localization. Hierarchical clustering shows two epithelial clusters and five nonepithelial clusters. B, PCA of centered log ratios of phenotype proportions across the ROIs. A segregation of urolithin-low and -high groups can be visualized. PC, principal component. C, Compositional bar plots showing the percentage of cells belonging to each cluster for each individual ROI, stratified by low and high, normal and polyp tissues, clearly highlight an increase in vimentin-containing APC cluster. D, Projections of phenotype clusters onto two urolithin-high ROIs using segmentation masks are shown, highlighting the dense localization of the lymphocytes including T and B cells (lymphocytes; boxed). E, Corresponding IMC images of CD3, CD20, and EPCAM/e-cadherin to show that dense lymphocyte aggregation could be due to the formation of lymphoid structures.

References

    1. Kang I, Buckner T, Shay NF, Gu L, Chung S. Improvements in metabolic health with consumption of ellagic acid and subsequent conversion into urolithins: evidence and mechanisms. Adv Nutr 2016;7:961–72. - PMC - PubMed
    1. Selma MV, Beltrán D, Luna MC, Romo-Vaquero M, García-Villalba R, Mira A, et al. Isolation of human intestinal bacteria capable of producing the bioactive metabolite isourolithin A from ellagic acid. Front Microbiol 2017;8:1521. - PMC - PubMed
    1. García-Villalba R, Giménez-Bastida JA, Cortés-Martín A, Ávila-Gálvez MÁ, Tomás-Barberán FA, Selma MV, et al. Urolithins: a comprehensive update on their metabolism, bioactivity, and associated gut microbiota. Mol Nutr Food Res 2022;66:e2101019. - PMC - PubMed
    1. Ginefra P, Hope HC, Chiang Y-H, Nutten S, Blum S, Coukos G, et al. Urolithin-A promotes CD8+ T cell-mediated cancer immunosurveillance via FOXO1 activation. Cancer Res Commun 2024;4:1189–98. - PMC - PubMed
    1. Denk D, Petrocelli V, Conche C, Drachsler M, Ziegler PK, Braun A, et al. Expansion of T memory stem cells with superior anti-tumor immunity by Urolithin A-induced mitophagy. Immunity 2022;55:2059–73.e8. - PubMed

Substances