. 2025 Apr;12(4):805-820.
doi: 10.1002/acn3.52299. Epub 2025 Feb 25.

Evidence of blood-brain barrier dysfunction and CSF immunoglobulin synthesis in Down Syndrome Regression Disorder

Affiliations

Evidence of blood-brain barrier dysfunction and CSF immunoglobulin synthesis in Down Syndrome Regression Disorder

Jonathan D Santoro et al. Ann Clin Transl Neurol. 2025 Apr.

Abstract

Objectives: This study sought to evaluate proteomic, metabolomic, and immune signatures in the cerebrospinal fluid of individuals with Down Syndrome Regression Disorder (DSRD).

Methods: A prospective case-control study comparing proteomic, metabolomic, and immune profiles in individuals with DSRD was performed. Samples were obtained from a biorepository of affected individuals and compared to clinically available data and previously obtained neurodiagnostic studies. Individuals with DSRD were compared to individuals with established neuroinflammatory conditions (e.g., multiple sclerosis), and neurotypical controls undergoing a lumbar puncture for headaches. Samples underwent high-throughput proteomic, metabolomic, and immune marker profiling. Data was compared across groups and clinical phenotypes. Gene set enrichment analysis and pathway analyses were utilized to analyze the data.

Results: In total, 34 individuals with DSRD, 22 neuroinflammatory controls, and 27 neurotypical controls were enrolled in the study. We observed a highly significant concordance in dysregulated proteomics signatures in DSRD and neuroinflammatory controls versus healthy controls, most prominently upregulation of many immunoglobulin sequences. In addition, individuals with DSRD displayed strong upregulation of liver-derived plasma proteins and erythrocyte proteins in the CSF, indicating poor blood-brain barrier integrity. The immune marker profile of DSRD is clearly similar to other neuroimmunological conditions, including strong elevation of MIP3-α, eotaxin, and IFN-γ.

Interpretation: Individuals with DSRD have unique CSF proteomic and metabolomic signatures consistent with neuroinflammation and increased blood-brain barrier permeability. The CSF of individuals with DSRD was more comparable to individuals with neuroinflammatory disorders than neurotypical controls, indicating the potential for an immune etiology of disease.


Conflict of interest statement

The authors report no relevant conflicts of interest‐related data presented.

Figures
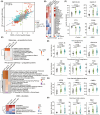
Figure 1
Figure 1
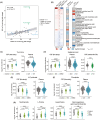
Proteomic dysregulation in individuals with Down Syndrome Regression Disorder (DSRD) shows similarities to neuroinflammatory conditions. (A) Scatter plot showing the correlation of fold changes of proteins in the cerebrospinal fluid (CSF) between individuals with Down Syndrome Regression Disorder (DSRD, n = 34) versus neurotypical controls (Control, n = 22) and neuroinflammatory controls (NIC, n = 27) versus neurotypical controls. The gray dotted line represents the diagonal, and the blue line represents the linear fit with 95% confidence intervals in gray. Proteins with significant (q < 0.1) fold change in both analyses are shown in red, significant in only NIC versus Control shown in green, significant in only DSRD versus Control shown in blue, and those not significant in either of the comparisons are shown in gray. Spearman correlation coefficient (rho) and p‐value are provided in the top left corner. (B) Heatmaps highlighting the proteins with the top 5 strongest positive and negative fold changes in pairwise comparisons among the three sample groups (left), and their fold changes in the analysis of the plasma proteome of individuals with trisomy 21 (T21, n = 25) versus euploid controls (D21, n = 25) (right) using linear models. Asterisks indicate significant fold changes (q < 0.1) after Benjamini‐Hochberg adjustment for multiple hypothesis testing. (C) Sina plots showing relative abundances of IGKV1D‐33, IGHV3‐11, FTO, and CCN2 in Controls (n = 22, gray), NIC (n = 27, green), and DSRD (n = 34, blue). Statistics above lines between sample groups represent q‐values derived from linear models and adjusted using the Benjamini‐Hochberg method. Boxes represent interquartile ranges and medians, with notches approximating 95% confidence intervals. (D) Heatmaps showing pathways and hallmarks enriched among proteins with positive fold changes in all pairwise comparisons using Metascape and IPA and analysis of all proteins ranked by log2(fold change) multiplied by −log10(p‐value) in Hallmark Gene Set Enrichment Analysis. Asterisks indicate significant enrichment (q < 0.1) after Benjamini‐Hochberg adjustment. E‐H Sina plots showing relative abundances of proteins from select pathways: immunoglobulins IGHV1‐18, IGHV3‐15, and IGHV4‐34 (E), complement and coagulation proteins C9, F13B, and FGG (F), liver‐derived plasma proteins APOB, HPR, and C4BPA (G), and red blood cell proteins HBD, CA1, and HBA1 (H). q‐values displayed above lines between sample groups are derived from linear models and adjusted using the Benjamini‐Hochberg method. Boxes represent interquartile ranges and medians, with notches approximating 95% confidence intervals.
Figure 2
Figure 2
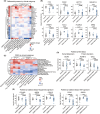
Metabolomic dysregulation in individuals with Down Syndrome Regression Disorder (DSRD). (A) Scatter plot showing the correlation of fold changes of metabolites in the cerebrospinal fluid (CSF) between individuals with Down Syndrome Regression Disorder (DSRD, n = 34) versus neurotypical controls (Control, n = 22) and neuroinflammatory controls (NIC, n = 27) versus neurotypical controls. The gray dotted line represents the diagonal, and the blue line represents the linear fit with 95% confidence intervals in gray. Metabolites with significant (q < 0.1) fold change in DSRD versus Control alone are shown in blue, those significant in NIC versus Control alone are shown in green, and those not significant in either of the comparisons are shown in gray. Spearman correlation coefficient (rho) and p‐value are provided in the top left corner. (B) Heatmaps of the metabolites with significant (q < 0.1) fold changes in pairwise comparisons among the three sample groups (left), their fold changes in the plasma metabolome of individuals with trisomy 21 (T21, n = 316) versus euploid controls (D21, n = 103) (middle), and the cerebrospinal fluid (CSF) of older individuals with trisomy 21(T21, n = 50) versus euploid controls (D21, n = 50) (right) using linear models. Asterisks indicate significant fold changes (q < 0.1) after Benjamini‐Hochberg adjustment for multiple hypothesis testing. The gray color indicates analytes that were not detected in a dataset. C‐G Sina plots showing relative abundances of Thymidine (C), Heptanoic acid (D), 4‐Pyridoxate (E), Phosphate (F), and Nicotinamide, L‐Proline, Acetylcholine and Gamma‐glutamyl‐gamma‐aminobutyrate (G), in cerebrospinal fluid (CSF) of Controls (n = 22, gray), NIC (n = 27, green), and DSRD (n = 34, blue), and where detected, their levels in plasma of D21 (n = 103, gray) and T21 (n = 316, dark blue) and, CSF of D21 (n = 50, gray) and T21(n = 50, dark green). Statistics above lines between sample groups represent q‐values derived from linear models and adjusted using the Benjamini‐Hochberg method. Boxes represent interquartile ranges and medians, with notches approximating 95% confidence intervals.
Figure 3
Figure 3
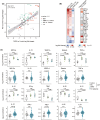
Association of proteomic and metabolomic features to clinical phenotypes of Down Syndrome Regression Disorder (DSRD). (A) Heatmaps of proteins with the top 5 strongest positive and negative significant (q < 0.1) differential abundance in individuals with Down Syndrome Regression Disorder (DSRD, n = 34) compared to neurotypical controls (Control, n = 22) (left) and all proteins with a significant (q < 0.1) fold change in DSRD individuals in the presence versus absence of clinical phenotypes (right). Asterisks indicate significant fold changes (q < 0.1) after Benjamini‐Hochberg adjustment for multiple hypothesis testing. (B) Sina plots showing relative abundances of proteins with significant differential abundance in individuals with DSRD and catatonia. Neurotypical controls are shown in gray (n = 22), DSRD individuals without catatonia in light blue (n = 9), and DSRD individuals with catatonia in dark blue (n = 25). Statistics above lines between sample groups represent q‐values derived from linear models and adjusted using the Benjamini‐Hochberg method. Boxes represent interquartile ranges and medians, with notches approximating 95% confidence intervals. (C) Heatmap showing hallmarks enriched among individuals with DSRD in the presence of a clinical phenotype using Gene Set Enrichment Analysis of all proteins ranked by log2(fold change) multiplied by its −log10(p‐value). Asterisks indicate significant enrichment (q < 0.1) after Benjamini‐Hochberg adjustment. (D and E) Sina plots showing relative abundances of proteins from Heme Metabolism and Protein Secretion hallmarks in individuals with DSRD with EEG abnormality (D), and Myogenesis and Epithelial Mesenchymal Transition (EMT) hallmarks in individuals with DSRD with catatonia (E). Neurotypical controls are shown in gray (n = 22), DSRD individuals without the clinical phenotype in light blue (n = 9 for catatonia, n = 24 for EEG abnormality), and DSRD individuals with the clinical phenotype in dark blue (n = 25 for catatonia, n = 10 for EEG abnormality). Statistics above lines between sample groups represent p‐values derived from the Wilcoxon test. Boxes represent interquartile ranges and medians, with notches approximating 95% confidence intervals.
Figure 4
Figure 4
Neuroinflammatory profile of Down Syndrome Regression Disorder (DSRD). (A) Scatter plot showing the correlation of fold changes of inflammatory and immune markers in the cerebrospinal fluid (CSF) between individuals with Down Syndrome Regression Disorder (DSRD, n = 11) versus neurotypical controls (Control, n = 11) and neuroinflammatory controls (NIC, n = 12) versus neurotypical controls. The blue line represents the linear fit with 95% confidence intervals in gray. Marker molecules with significant (q < 0.1) fold change in both comparisons are shown in red, significant only in DSRD versus Control are shown in blue, significant only in NIC versus Control are shown in green, and those not significant in either of the comparisons are shown in gray. Spearman correlation coefficient (rho) and p‐value are provided in the top left corner. (B) Heatmaps showing the immune and inflammatory markers with significant (q < 0.1) fold changes in pairwise comparisons among the three sample groups (left), and their fold changes in the plasma metabolome of individuals with trisomy 21 (T21, n = 143) versus euploid controls (D21, n = 39) (right) using linear models. Asterisks indicate significant fold changes (q < 0.1) after Benjamini‐Hochberg adjustment for multiple hypothesis testing. The gray color indicates analytes that were not detected in a dataset. (C) Sina plots showing relative abundances of selected immune markers in cerebrospinal fluid (CSF) of Controls (n = 11, gray), NIC (n = 12, green), and DSRD (n = 11, blue) (top), and their levels in plasma of D21 (n = 39, gray) and T21 (n = 143, dark blue) (bottom). Statistics above lines between sample groups represent q‐values derived from linear models and adjusted using the Benjamini‐Hochberg method. Boxes represent interquartile ranges and medians, with notches approximating 95% confidence intervals.

References

    1. de Graaf G, Buckley F, Skotko BG. Estimates of the live births, natural losses, and elective terminations with Down syndrome in the United States. Am J Med Genet A. 2015;167:756‐767. - PubMed
    1. Rosso M, Fremion E, Santoro SL, et al. Down syndrome disintegrative disorder: a clinical regression syndrome of increasing importance. Pediatrics. 2020;145:e20192939. - PubMed
    1. Worley G, Crissman BG, Cadogan E, Milleson C, Adkins DW, Kishnani PS. Down syndrome disintegrative disorder: new‐onset autistic regression, dementia, and insomnia in older children and adolescents with Down syndrome. J Child Neurol. 2015;30:1147‐1152. - PubMed
    1. Mircher C, Cieuta‐Walti C, Marey I, et al. Acute regression in young people with Down syndrome. Brain Sci. 2017;7:1‐9. - PMC - PubMed
    1. Santoro JD, Partridge R, Tanna R, et al. Evidence of neuroinflammation and immunotherapy responsiveness in individuals with down syndrome regression disorder. J Neurodev Disord. 2022;14:35. - PMC - PubMed

MeSH terms

LinkOut - more resources