. 2025 Apr;12(16):e2417326.
doi: 10.1002/advs.202417326. Epub 2025 Feb 25.

Lipid Droplets Metabolism Mediated by ANXA7-PPARγ Signaling Axis Regulates Spinal Cord Injury Repair in Mice

Affiliations

Lipid Droplets Metabolism Mediated by ANXA7-PPARγ Signaling Axis Regulates Spinal Cord Injury Repair in Mice

Lu Chen et al. Adv Sci (Weinh). 2025 Apr.

Abstract

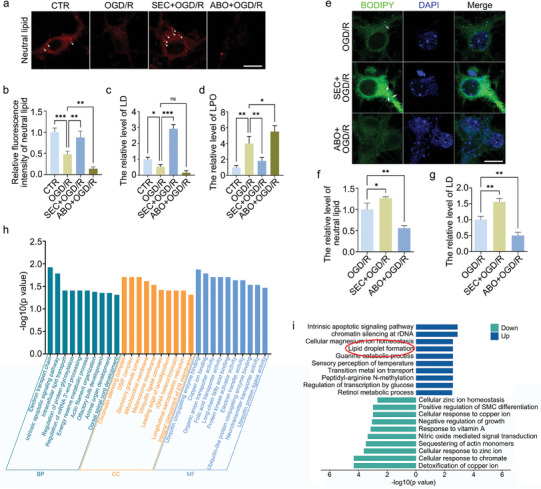
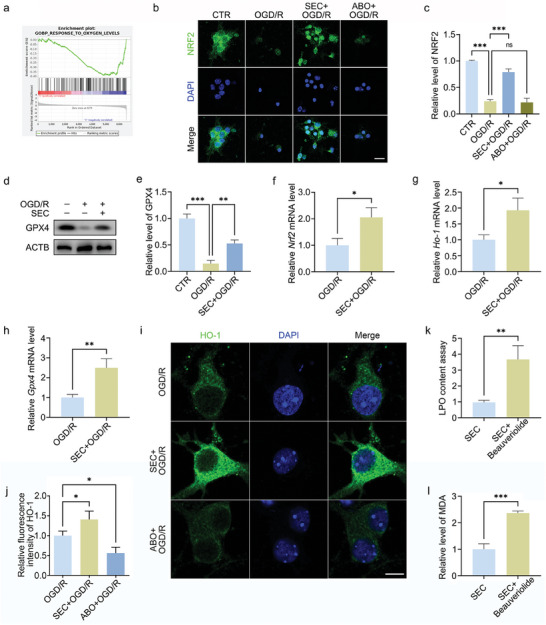
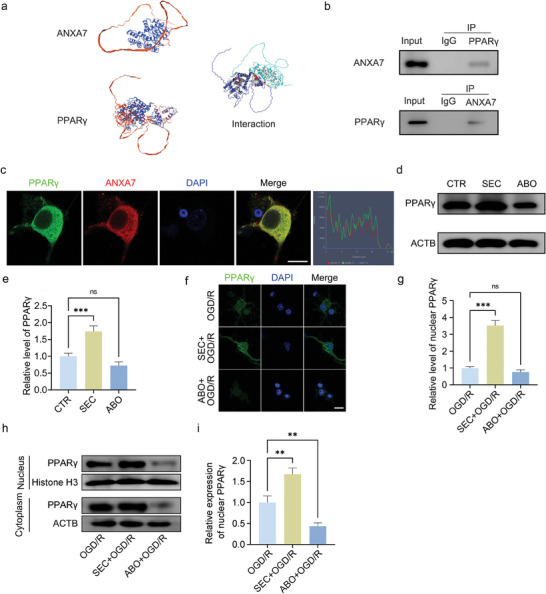
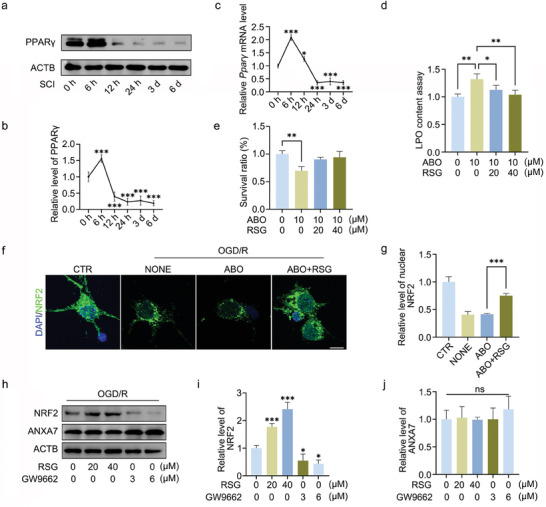
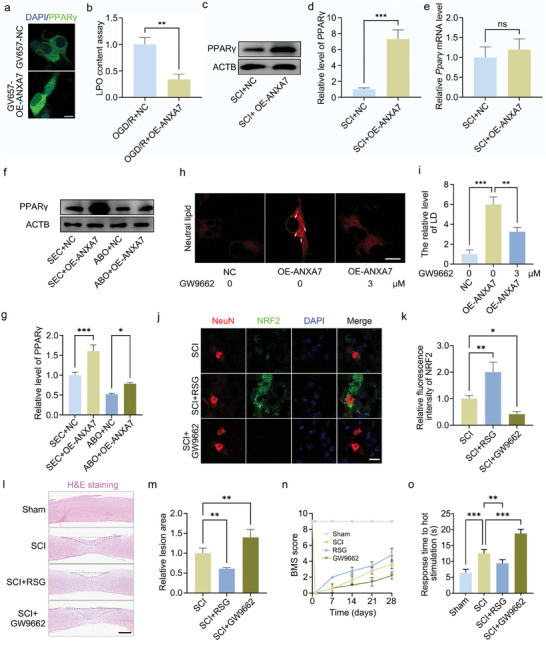
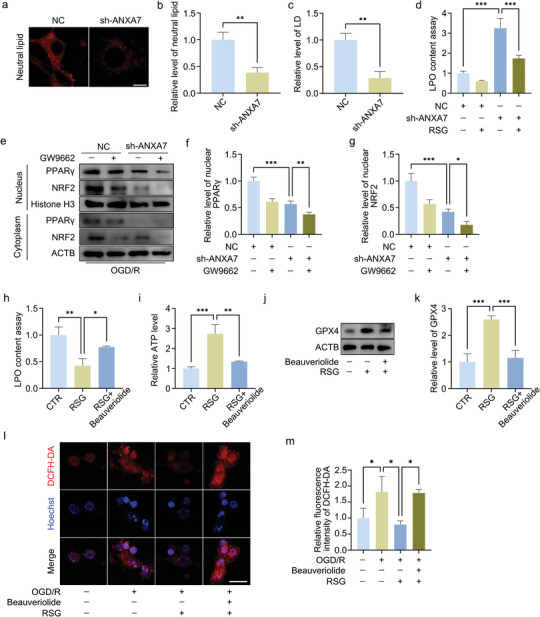
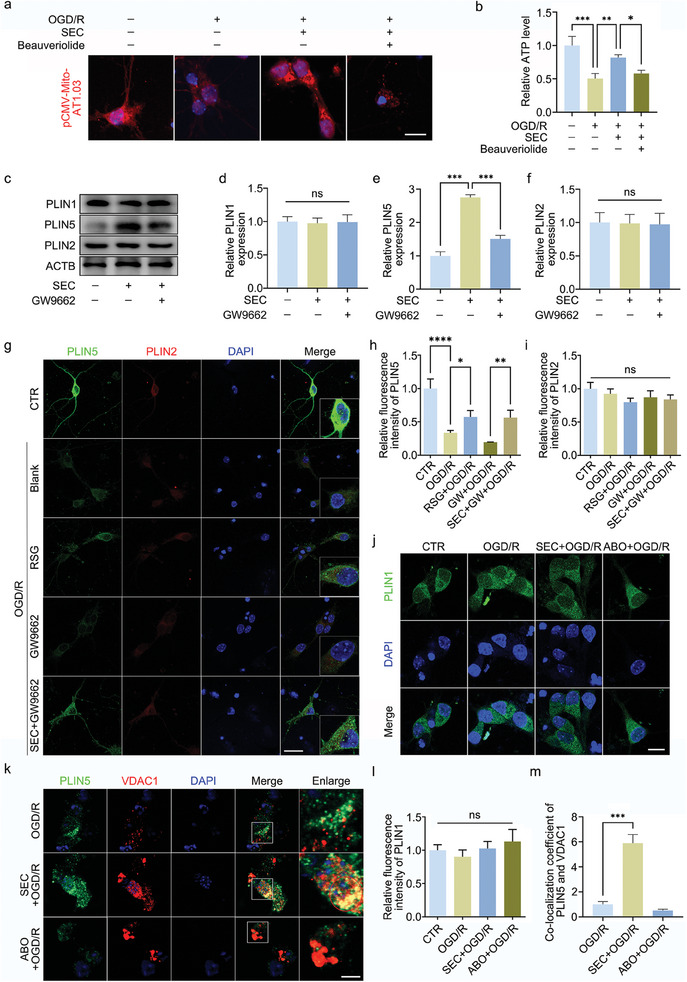
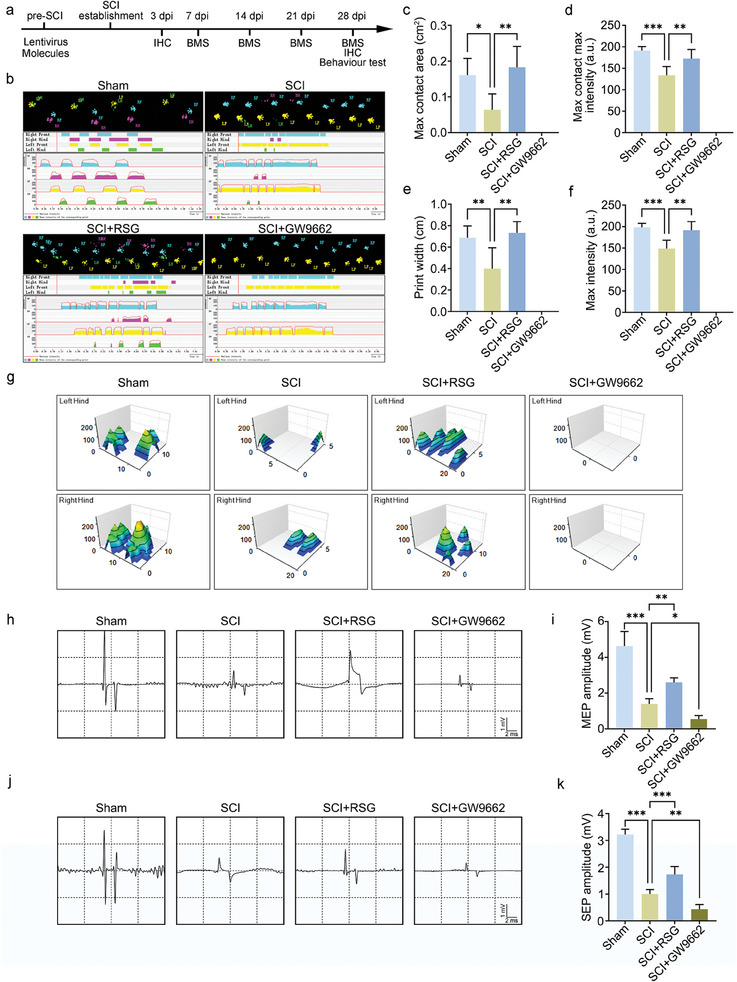
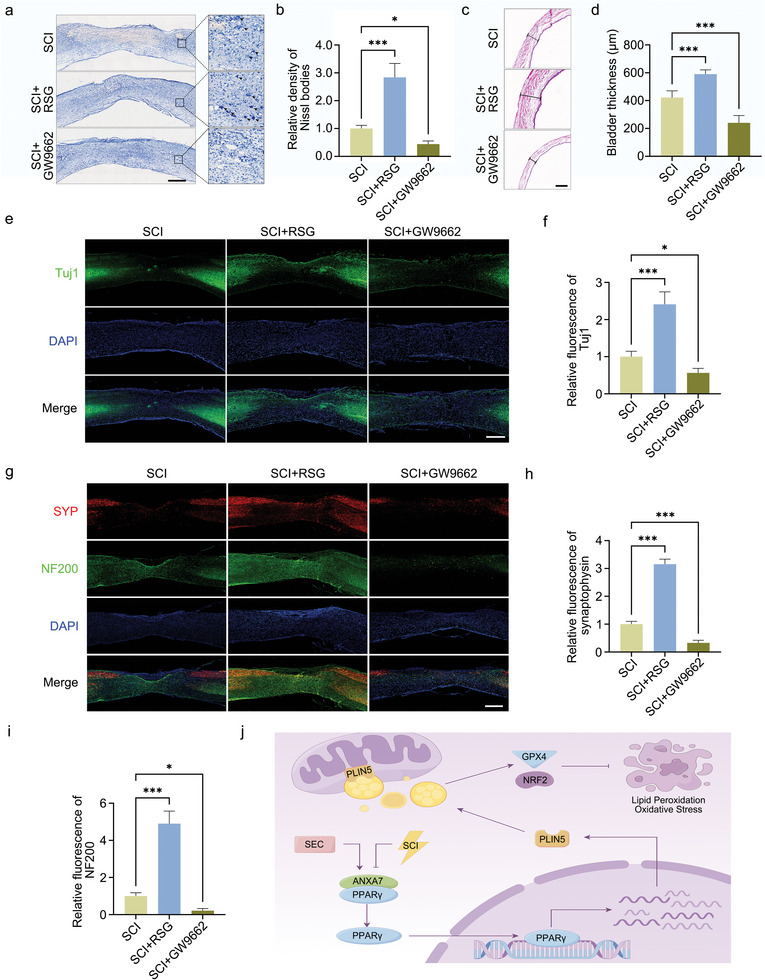
Spinal cord injury is characterized by high incidence and high disability, and the specific targets and drugs have not yet been explored. Lipid droplet is a type of organelles that regulates lipid metabolism and oxidative stress. And the regulatory mechanisms of lipid droplets on spinal cord injury remain unclear. Herein, it is found that GTPase activation of Annexin A7 (ANXA7) promotes the up-regulation of genes related to lipid droplet formation. ANXA7 can interact with peroxisome proliferator-activated receptor gamma (PPARγ) to enhance the stability of PPARγ, and promote lipid droplet formation and interaction with mitochondria through promoting Perilipin 5 expression. Then, oxidative stress and lipid peroxidation are inhibited due to the promotion of nuclear factor erythroid 2-related factor 2 (NRF2) nuclear translocation and expression of glutathione peroxidase 4 (GPX4). ANXA7 activation promotes lipid droplet formation and mitochondria-lipid droplet interaction by enhancing nuclear translocation of PPARγ, which contributes to inhibiting lipid peroxidation and neuron damage. Furthermore, activation of PPARγ can promote neural function recovery and spinal cord repair in mice. The focus of this study is to investigate the effects of lipid droplets regulated by ANXA7/PPARγ, providing new targets and strategies for spinal cord injury.

Keywords: ANXA7; PPARγ; lipid droplet; oxidative stress; spinal cord injury.


Conflict of interest statement

The authors declare no conflict of interest.

Figures

Figure 1
Figure 1
Lipid droplets exist in neurons and activation of ANXA7 promotes lipid droplets formation. a–c) The OGD/R model was constructed on primary neurons after SEC or ABO treatment for 1 h. The neutral lipid dye HCS LipidTOX was used to detect the levels of neutral lipids and lipid droplets in different groups. Scale bar: 10 µm. d) The OGD/R model was constructed on neurons treated with SEC or ABO for 1 h, and the lipid peroxidation (LPO) kit was used to detect the lipid peroxidation level of neurons. e–g) Lipid droplets in neurons were stained by BODIPY 493/503 after OGD/R treatment with SEC or ABO. Scale bar: 10 µm. h) GO analysis was performed between SEC+OGD/R group and OGD/R treatment group after 4D proteomic sequencing. i) The results of up/down regulated activities in biological process (BP) analysis. The data were presented as mean ± SD, and ANOVA was used for analysis. * p < 0.05, ** p < 0.01, *** p < 0.001, n = 3.
Figure 2
Figure 2
ANXA7 activation could suppress oxidative stress induced by OGD/R treatment. a) GSEA analysis after 4D proteome sequencing between SEC+OGD/R and OGD/R treatment group. b,c) OGD/R model was constructed on neurons after SEC or ABO treatment for 1 h, and NRF2 protein level was detected by immunofluorescence. Scale bar: 20 µm. d,e) The OGD/R model was constructed on neurons after SEC treatment for 1 h, and the GPX4 protein level was detected by WB. f–h) OGD/R model was constructed on neurons after SEC treatment for 1 h, and mRNA levels of Nrf2, Ho‐1, and Gpx4 in different treatment groups were detected by qPCR. i,j) HO‐1 fluorescent staining on neurons after OGD/R with/without SEC or ABO treatment. Scale bar: 10 µm. k,l) LPO and malondialdehyde (MDA) levels were detected in neurons treated with SEC or combination of SEC and Beauveriolide III for 1 h after OGD/R. The data were presented as mean ± SD, and Student's T‐test was used for analysis between two groups, while ANOVA was used among more than two groups. * p < 0.05, ** p < 0.01, *** p < 0.001, n = 3.
Figure 3
Figure 3
ANXA7 could interact with PPARγ. a) SWISS‐MODEL/Vasker Lab/PDBePISA websites were used to predict structure of ANXA7, PPARγ, and 3D structure diagram of their interaction. b) Co‐immunoprecipitation was used to detect the interaction between ANXA7 and PPARγ. c) Immunofluorescence was used to detect the colocalization of ANXA7 and PPARγ, and the colocalization analysis was conducted. Scale bar: 10 µm. d,e) The protein level of PPARγ was detected by WB after treatment SEC or ABO for 1 h. f,g) Neurons were treated with SEC or ABO for 1 h before OGD/R, and immunofluorescence was used to detect the nuclear level of PPARγ. Scale bar: 10 µm. h,i) Nuclear expression of PPARγ was detected by WB. The data were presented as mean ± SD, and ANOVA was used for analysis. ** p < 0.01, *** p < 0.001, n = 3.
Figure 4
Figure 4
Expression changes of PPARγ after spinal cord injury and its regulatory effect on NRF2. a,b) The mouse model of spinal cord injury was constructed. The spinal cord tissue was extracted and the protein level of PPARγ was detected by WB on different time point after spinal cord injury. c) The mouse model of spinal cord injury was constructed, and qPCR was used to detect the mRNA level changes of Pparγ on different time point after spinal cord injury. d) Neurons were treated with rosiglitazone and ABO separately or in combination for 1 h, and LPO levels of the neurons were detected after OGD/R treatment. e) Neurons were treated with rosiglitazone and ABO separately or in combination for 1 h, and the survival ratio of neurons was detected by CCK8 after OGD/R. f,g) Rosiglitazone and ABO were used to treat neurons separately or in combination for 1 h, and immunofluorescence was conducted to detect nuclear translocation level of NRF2 after OGD/R. Scale bar: 10 µm. h–j) Neurons were treated with different concentrations of rosiglitazone and GW9662 for 1 h, respectively. After the OGD/R model was constructed, the protein levels of ANXA7 and NRF2 were detected by WB. The data were presented as mean ± SD, and ANOVA was used for analysis. * p < 0.05, ** p < 0.01, *** p < 0.001, n = 3.
Figure 5
Figure 5
Regulation of ANXA7 to PPARγ and the effect of PPARγ on spinal cord injury repair. a,b) OGD/R model of neurons was constructed after transfected with GV657‐negative control or GV657‐OE‐ANXA7 plasmids. Then the protein expression of PPARγ and LPO content were detected by immunofluorescence and LPO assay kit. Scale bar: 10 µm. c–e) The spinal cord injury mouse model was established. After 4 days, the spinal cord tissue was extracted and PPARγ was detected by WB and qPCR in different treatment groups. f,g) After transfected with ANXA7 overexpression lentivirus, neurons were treated with/without SEC or ABO for 1 h before OGD/R treatment, and protein level of PPARγ was detected by WB. h,i) After transfected with ANXA7 overexpression lentivirus, neurons were treated with/without GW9662 for 1 h before OGD/R treatment, and lipid droplet levels were detected. Scale bar: 10 µm. j,k) Mice were pretreated with rosiglitazone or GW9662, and the expression of NRF2 were detected by immunofluorescence 4 days after SCI. Scale bar: 10 µm. l,m) Mice were pretreated with rosiglitazone or GW9662, HE staining was conducted on spinal cord sections and the lesion area was measured. Scale bar: 500 µm. n) BMS score analysis on mice treated with rosiglitazone or GW9662 after spinal cord injury for 0, 1, 7, 14, 21, 28 days. o) Response times to hot stimulation in mice treated with rosiglitazone or GW9662 after spinal cord injury for 28 days. The data were presented as mean ± SD, and Student's T‐test was used for analysis between two groups, while ANOVA was used among more than two groups. * p < 0.05, ** p < 0.01, *** p < 0.001, n = 3.
Figure 6
Figure 6
Effect of PPARγ on LDs formation and oxidative stress. a–c) Neutral lipid staining in primary neurons treated with negative control and sh‐ANXA7 lentivirus, and statistical analysis of neutral lipid level and LDs number was performed. Scale bar: 10 µm. d) Primary neurons were treated with negative control or shANXA7 lentivirus, with/without rosiglitazone for 1 h, and lipid peroxidation levels were detected. e–g) The OGD/R model was constructed after primary neurons transfected with negative control or shANXA7 lentivirus were treated with/without GW9662 for 1 h, and nuclear level of PPARγ and NRF2 were detected. h,i) Lipid peroxidation and mitochondrial ATP production were detected by LPO and ATP kits after 1 h of treatment with rosiglitazone and/or Beauveriolide III, respectively. j,k) Western Blot detection of GPX4 protein levels in neurons treated with Rosiglitazone and/or Beauveriolide III for 1 h before OGD/R treatment. l,m) Neurons were treated with rosiglitazone or Beauveriolide III and in combination with rosiglitazone and Beauveriolide III for 1 h, and then OGD/R model was constructed. ROS probe DCFH‐DA was used to detect ROS level. Scale bar: 20 µm. The data were presented as mean ± SD, and Student's T‐test was used for analysis between two groups, while ANOVA was used among more than two groups. * p < 0.05, ** p < 0.01, *** p < 0.001, n = 3.
Figure 7
Figure 7
ANXA7‐PPARγ regulates LDs formation by affecting PLIN5 expression. a,b) OGD/R model was constructed after SEC treated neurons for 1 h, and the SEC pretreatment group was treated with Beauveriolide III during reoxygenation processing. Mitochondrial ATP probe pCMV‐Mito‐AT1.03 and ATP test kit were used to detect the level of ATP in neurons. Scale bar:10 µm. c–f) After treatment by SEC with/without GW9662 for 1 h, OGD/R model was constructed, and the levels of PLIN1, PLIN2, and PLIN5 were detected by WB. g) Neurons were treated with rosiglitazone, GW9662, or combination with SEC and GW9662, and OGD/R treatment was conducted. The immunofluorescence was used to detect the expression of PLIN2 and PLIN5. Scale bar: 20 µm. h,i) The quantization analysis of PLIN5 and PLIN2 fluorescence. j) Neurons were treated with SEC or ABO for 1 h, the expression of PLIN1 were detected by immunofluorescence. Scale bar: 10 µm. k) Neurons were treated with SEC or ABO for 1 h, OGD/R model was constructed, and the co‐localization level of PLIN5 and VDAC1 were detected by immunofluorescence. Scale bar: 10 µm. l) The quantization analysis of PLIN1 fluorescence. m) The quantization result of the colocalization coefficient of the above processing. The data were presented as mean ± SD, and ANOVA was used for analysis. * p < 0.05, ** p < 0.01, *** p < 0.001, n = 3.
Figure 8
Figure 8
Effect of PPARγ on neural function recovery. a) The flow chart of animal experiments. b) Gait analysis of mice in group treated with sham, SCI, SCI+ rosiglitazone, and SCI+GW9662. c–f) Footprint parameters about max contact area, max contact max intensity, print width, and max intensity from mice treated with sham, SCI, SCI+ rosiglitazone, and SCI+GW9662. g) Area and pressure analysis of footprint from mice treated with sham, SCI, SCI+ rosiglitazone, and SCI+GW9662. h: Motor‐evoked potential (MEP) of mice in group treated with sham, SCI, SCI+ rosiglitazone, and SCI+GW9662. i) Statistical analysis about MEP amplitude. j) Sensory‐evoked potential (SEP) of mice in group treated with sham, SCI, SCI+ rosiglitazone, and SCI+GW9662. k) Statistical analysis about SEP amplitude. The data were presented as mean ± SD, and ANOVA was used for analysis. * p < 0.05, ** p < 0.01, *** p < 0.001, n = 5.
Figure 9
Figure 9
Effect of PPARγ regulation on spinal cord tissue repair. a) Nissl staining of spinal cord tissues 4 days after injury in group SCI, SCI+ rosiglitazone, and SCI+GW9662. Scale bar: 500 µm. b) Statistical analysis about density of Nissl bodies. c) HE staining of bladder from mice in group SCI, SCI+ rosiglitazone, and SCI+GW9662. Scale bar: 250 µm. d) Statistical analysis about bladder thickness. e) Tuj1 fluorescence staining on spinal cord tissues 28 days after injury. Scale bar: 500 µm. f) Statistical analysis about Tuj1 fluorescence intensity. g) Synaptophysin and NF200 fluorescence staining on spinal cord tissues 28 days after injury. Scale bar: 500 µm. h,i) Statistical analysis about synaptophysin and NF200 fluorescence intensity. j) Schematic diagram about regulatory mechanism. The data were presented as mean ± SD, and ANOVA was used for analysis. * p < 0.05, *** p < 0.001, n = 5.

Similar articles

References

    1. Collaborators G. N., Lancet. Neurol. 2019, 18, 459. - PubMed
    1. Wertheim L., Edri R., Goldshmit Y., Kagan T., Noor N., Ruban A., Shapira A., Gat‐Viks I., Assaf Y., Dvir T., Adv. Sci. 2022, 9, e2105694. - PMC - PubMed
    1. Sofroniew M. V., Nature 2018, 557, 343. - PubMed
    1. Rowald A., Komi S., Demesmaeker R., Baaklini E., Hernandez‐Charpak S. D., Paoles E., Montanaro H., Cassara A., Becce F., Lloyd B., Newton T., Ravier J., Kinany N., D'Ercole M., Paley A., Hankov N., Varescon C., McCracken L., Vat M., Caban M., Watrin A., Jacquet C., Bole‐Feysot L., Harte C., Lorach H., Galvez A., Tschopp M., Herrmann N., Wacker M., Geernaert L., et al., Nat. Med. 2022, 28, 260. - PubMed
    1. David G., Mohammadi S., Martin A. R., Cohen‐Adad J., Weiskopf N., Thompson A., Freund P., Nat. Rev. Neurol. 2019, 15, 718. - PubMed

LinkOut - more resources