. 2025 Feb 10;14(4):248.
doi: 10.3390/cells14040248.

Combinational Inhibition of MEK and AKT Synergistically Induces Melanoma Stem Cell Apoptosis and Blocks NRAS Tumor Growth

Affiliations

Combinational Inhibition of MEK and AKT Synergistically Induces Melanoma Stem Cell Apoptosis and Blocks NRAS Tumor Growth

Ryyan Alobaidi et al. Cells. .

Abstract

Malignant melanoma is a lethal skin cancer containing melanoma-initiating cells (MICs), implicated in tumorigenesis, invasion, and drug resistance, and characterized by an elevated expression of stem cell markers, including CD133. siRNA knockdown of CD133 has been previously shown to enhance apoptosis induced by the MEK inhibitor trametinib in melanoma cells. This study investigates the underlying mechanisms of CD133's anti-apoptotic activity in patient-derived BAKP melanoma, harboring the difficult-to-treat NRASQ61K driver mutation, after CRISPR-Cas9 CD133 knockout or Doxycycline (Dox)-inducible re-expression of CD133. CD133 knockout in BAKP cells increased trametinib-induced apoptosis by reducing anti-apoptotic p-AKT and p-BAD and increasing pro-apoptotic BAX. Conversely, Dox-induced CD133 expression diminished apoptosis in trametinib-treated cells, coincident with elevated p-AKT, p-BAD, and decreased activation of BAX and caspase-3. However, trametinib in combination with pan-AKT inhibitor capivasertib reduced cell survival as measured by XTT viability assays and apoptosis and colony formation assays, independent of CD133 status. CD133 may therefore activate a survival pathway wherein (1) increased AKT phosphorylation and activation induces (2) BAD phosphorylation and inactivation, which (3) decreases BAX activation, and (4) reduces caspases-3 activity and caspase-mediated PARP cleavage, leading to apoptosis suppression and drug resistance in melanoma. In vivo mouse xenograft studies using Dox-inducible melanoma cells revealed increased rates of tumor growth after induction of CD133 expression in trametinib-treated +Dox mice, an effect which was synergistically suppressed by combination treatment. Targeting nodes of the AKT and MAPK survival pathways with trametinib and capivasertib highlights the potential for combination therapies for NRAS-mutant melanoma stem cells for the development of more effective treatments for patients with high-risk melanoma.

Keywords: CRISPR-Cas9; NRAS; capivasertib; drug resistance; trametinib; xenograft.


Conflict of interest statement

Author Peter Sykora was employed by the company Amelia Technologies, LLC. The remaining authors declare that the research was conducted in the absence of any commercial or financial relationships that could be construed as a potential conflict of interest. The company had no role in the design of the study; in the collection, analyses, or interpretation of data; in the writing of the manuscript, or in the decision to publish the results.

Figures
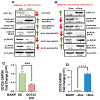
Figure 1
Figure 1
(A) CD133 CRISPR-Cas9 KO increases trametinib-induced apoptosis whereas (B) Doxycycline (Dox)-induced CD133 expression in BAKP cells decreases apoptosis (BAX activation, PARP cleavage, and caspase-3 activation) following trametinib treatment, stabilized by the upregulation of pro-survival pAKT and pBAD in CD133-expressing cells. The cells were incubated with 100 nM trametinib for 48 h, followed by immunoblot analysis with antibodies to cleaved active caspase 3 and its substrate—cleaved PARP, the pro-apoptotic active form of Bax, the anti-apoptotic phosphorylated form of BAD (p-BAD), and the pro-survival phosphorylated active form of AKT (p-AKT Ser473). After normalizing to β-actin, a densitometric analysis comparing the intensities of protein bands relative to bands with the highest intensities is shown in the immunoblots. Scans of whole-gel immunoblots for all the figures are shown in “Supplementary Materials” (Figure S1). (C,D) Knockdown of CD133 expression in BAKP CD133-KO cells (C) and upregulation of CD133 expression in inducible BAKP cells in the presence of Dox (+Dox; (D)), as verified by qRT-PCR analysis. p < 0.05 was considered significant; *** and **** represent p < 0.001, and p < 0.0001, respectively.
Figure 2
Figure 2
Capivasertib enhances apoptosis in trametinib-treated BAKP (A) and POT (B) melanoma cell lines. Cells were seeded in equal numbers in 6-well plates in triplicates, and they were then treated with trametinib and/or capivasertib. After 48 h of treatment, the cells were subjected to Annexin-APC/SYTOX Blue apoptosis assays. The percentage of total apoptosis (the sum of early and late apoptosis in the lower right and upper right quadrants of the dot plots, respectively) was quantified by flow cytometric analysis. The results are the means ± SEM of three replicates of a representative experiment; essentially the same results were obtained in three independent experiments. p < 0.05 was considered significant; *, **, and **** represent p < 0.05, p < 0.01, and p < 0.0001, respectively. (C) Dot plot data used to generate the bar graphs in (A,B). FL1 and FL2 represent fluorescence channel 1 and fluorescence channel 2, respectively. (D) Representative phase contrast (left panel) and fluorescence (right panel) images of BAKP cells showing the loss of mitochondrial membrane potential in BAKP cells treated with trametinib alone or in combination with capivasertib, but not in control cells or those incubated with capivasertib alone, indicating that apoptosis occurs through a mitochondrial-mediated pathway. Insets in the top left corners show enlargement of representative cells.
Figure 3
Figure 3
Effects of CD133 KO (A,C) or induced CD133 expression (B,D) on cell viability after treatment with trametinib and capivasertib, alone or in combination. Cells were plated in equal numbers in 6-well plates in triplicates and then treated for 48 h with trametinib and capivasertib, alone or in combination. The cells were then collected and subjected to XTT cell viability metabolic assays (A,B) and Sytox Blue dye exclusion assays (C,D). The percentage (%) of cell viability was quantified as described in Section 2. The results shown are the means ± SEM of three replicates of a representative experiment; essentially the same results were obtained in three independent experiments. p < 0.05 was considered significant. *, **, and **** represent p < 0.05, p < 0.01, and p < 0.0001, respectively.
Figure 4
Figure 4
(A) Annexin flow cytometric assays to assess apoptosis induction after treatment with trametinib and capivasertib alone or in combination. (B) Dot plot of data shown in (A); FL1 and FL2 represent fluorescence channel 1 and fluorescence channel 2, respectively.Equal numbers of BAKP-CD133 KO and control BAKP-SC cells were seeded in 6-well plates in triplicate and then treated for 48 h with trametinib, capivasertib, or in combination. After 48 h, the cells were subjected to Annexin-APC/SYTOX Blue assays. The percentage of total apoptosis was quantified by flow cytometric analysis. The results shown are the mean ± SEM of triplicates of a representative experiment; essentially the same results were obtained in three independent experiments. p < 0.05 was considered significant. ** represents p < 0.01; ns represents not significant.
Figure 5
Figure 5
Capivasertib in combination with trametinib elicits a maximal apoptotic response in both uninduced and Dox-induced CD133-expressing cells, as assessed by annexin flow cytometric assays (A). CD133 expression slightly reverses this response. Cells were seeded in equal numbers in 6-well plates in triplicates, incubated for 24 h with 1 µg/mL Dox to induce CD133 expression, and then treated for 48 h (A) with trametinib and capivasertib, alone or in combination. Cells were collected after treatment and subjected to Annexin-APC apoptosis assays. The percentage (%) of total apoptosis was quantified by flow cytometric analysis. (B) Dot plot of data shown in A; FL1 and FL2 represent fluorescence channel 1 and fluorescence channel 2, respectively. The results shown are the means ± SEM of three replicates of a representative experiment; essentially the same results were obtained in three independent experiments. p < 0.05 was considered significant. *** represents p < 0.001; ns represents not significant.
Figure 6
Figure 6
The combination of capivasertib plus trametinib synergistically reduces cell viability and induces apoptosis in melanoma cells. (A) Cells were seeded in equal numbers in 96-well plates in triplicate and then treated for 48 h with trametinib and capivasertib, alone or in combination (trametinib at variable concentrations and capivasertib at 1 µM). Cells were collected and subjected to XTT cell viability assays. (B) Cells were plated in a 6-well plate, exposed to the drugs alone or in combination as above, and then analyzed using flow cytometry after Annexin-APC/SYTOX Blue staining. (A,B) Bliss additivity was calculated and is shown as inverted triangles. Pink shading and unshaded areas represent synergy and antagonism, respectively. The results shown are the means ± SEM of three replicates of a representative experiment; essentially the same results were obtained in three independent experiments. p < 0.05 was considered significant. **** represents p < 0.0001.
Figure 7
Figure 7
(A) Long-term cell survival (clonogenic) assays reveal that treatments reduce colony formation in BAKP cells, with the combination of trametinib + capivasertib decreasing colony formation to the largest extent. Dox-inducible BAKP cells were incubated for 24 h with Dox, and then exposed to trametinib and capivasertib by themselves or in combination. Then, 48 h after treatment, the cells were replated, allowed to grow for 12 days, fixed, and stained, and the colonies of cells that survived treatment were counted. The results shown are the means ± SEM of three replicates of a representative experiment; essentially the same results were obtained in three independent experiments. p < 0.05 was considered significant. *** and **** represent p < 0.001 and p < 0.0001, respectively; ns represents not significant. (B) Images of representative 10 cm-plates with stained colonies reveal that the treatments reduced both colony counts and colony sizes. The insets show representative colony sizes.
Figure 8
Figure 8
(A) The immunoblot analysis reveals the effective inhibition of phosphorylation of AKT substrates (p-BAD and p-GSK-3β) by capivasertib by itself or in combination with trametinib. BAKP cells were incubated for 24 h with Dox and then exposed to trametinib or capivasertib alone or in combination with trametinib. Cell lysates were then subjected to immunoblot analysis with antibodies specific for CD133, phospho-BAD, p-GSK-3β, and cleaved caspase-3. Anti-β-actin was used for the confirmation of equal loading. (B) The indirect immunofluorescent analysis with antibodies to CD133 or the cleaved active form of caspase-3 reveals that treatment with a combination of trametinib (100 nM) + capivasertib (1 μM), but not either drug alone, markedly increases apoptotic caspase-3 activation in BAKP cells.
Figure 9
Figure 9
CD133 increases tumor growth, which is suppressed by the trametinib + capivasertib treatment in vivo. BAKP-inducible cells were used to induce subcutaneous tumors. (A) Tumor volumes in treated vs. vehicle control mice (+/− Dox). Bliss additivity was calculated in +Dox mice (B) or −Dox mice (C), and is shown as a dashed purple line, while the pink-shaded areas show regions where combination treatment demonstrates synergy and improvement over trametinib alone. (D) No effects on the body mass of mice over the treatment period were observed. (E) The immunoblot analysis of tumor lysates from xenografted mice shows apoptotic caspase-3 cleavage in the combination treatment only. The results shown are the means ± SEM of three replicates of a representative experiment; essentially the same results were obtained in three independent experiments. p < 0.05 was considered significant. *, **, and **** represent p < 0.05, p < 0.01, and p < 0.0001, respectively.
Figure 10
Figure 10
PI3K/AKT/Bcl2 and MAPK family pro-survival signaling pathway in CD133+ melanoma stem cells (MICs) and possible therapeutic targets.

References

    1. SEER . Cancer Statistics-Reports on Cancer-Cancer Stat Facts-Melanoma of the Skin. Surveillance, Epidemiology, and End Results (SEER) Program; Bethesda, MD, USA: 2024. [(accessed on 1 December 2024)]. Available online: www.seer.cancer.gov.
    1. Parkin D.M., Mesher D., Sasieni P. 13. Cancers attributable to solar (ultraviolet) radiation exposure in the UK in 2010. Br. J. Cancer. 2011;105((Suppl. S2)):S66–S69. doi: 10.1038/bjc.2011.486. - DOI - PMC - PubMed
    1. Conforti C., Zalaudek I. Epidemiology and Risk Factors of Melanoma: A Review. Dermatol. Pract. Concept. 2021;11:e2021161S. doi: 10.5826/dpc.11S1a161S. - DOI - PMC - PubMed
    1. Reddy B.Y., Miller D.M., Tsao H. Somatic driver mutations in melanoma. Cancer. 2017;123:2104–2117. doi: 10.1002/cncr.30593. - DOI - PubMed
    1. Simbulan-Rosenthal C.M., Haribabu Y., Vakili S., Kuo L.W., Clark H., Dougherty R., Alobaidi R., Carney B., Sykora P., Rosenthal D.S. Employing CRISPR-Cas9 to Generate CD133 Synthetic Lethal Melanoma Stem Cells. Int. J. Mol. Sci. 2022;23:2333. doi: 10.3390/ijms23042333. - DOI - PMC - PubMed

Publication types

MeSH terms