

Youth Who Control HIV on Antiretroviral Therapy Display Unique Plasma Biomarkers and Cellular Transcriptome Profiles Including DNA Repair and RNA Processing
- PMID: 39996757
- PMCID: PMC11853983
- DOI: 10.3390/cells14040285
Youth Who Control HIV on Antiretroviral Therapy Display Unique Plasma Biomarkers and Cellular Transcriptome Profiles Including DNA Repair and RNA Processing
Abstract
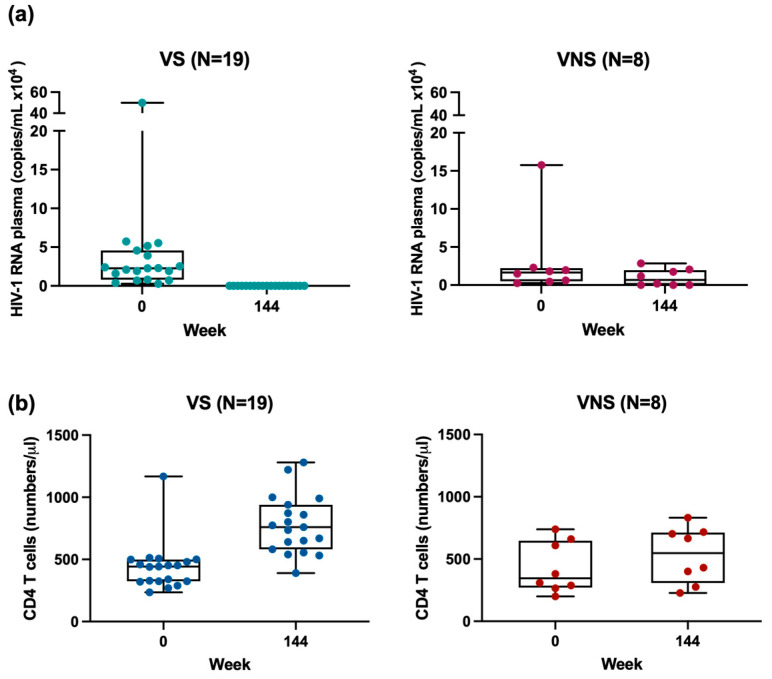
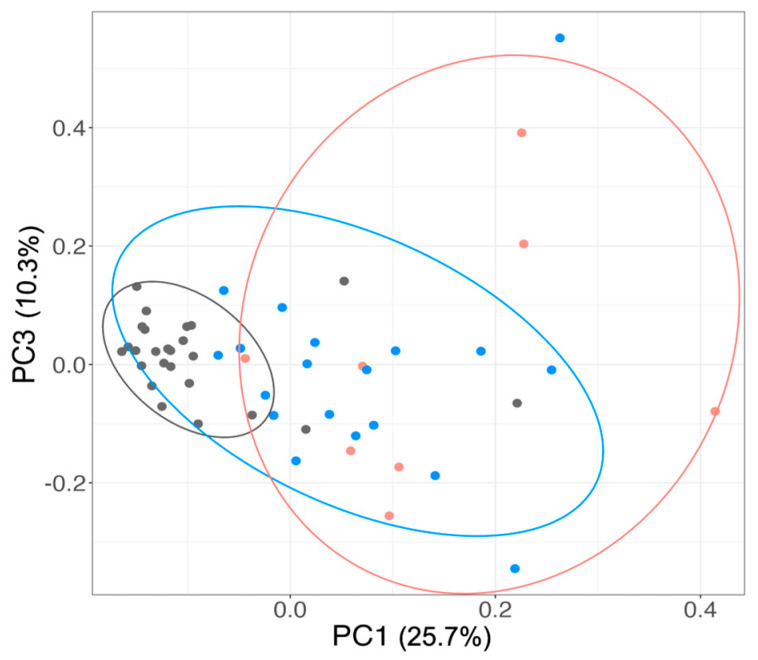
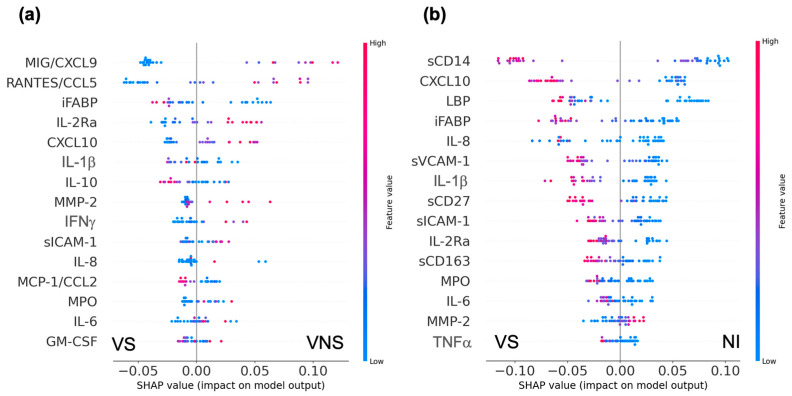
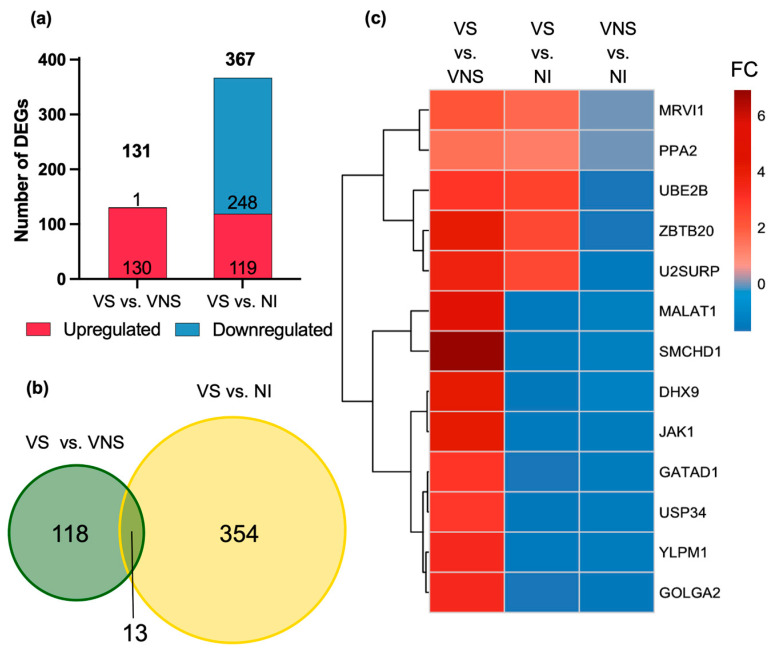
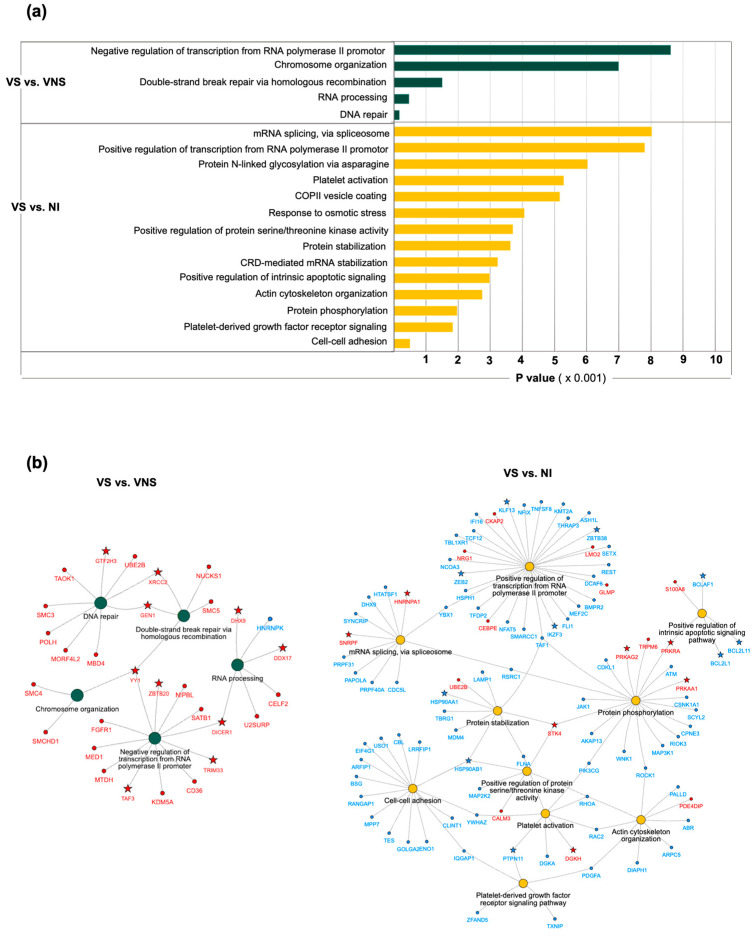
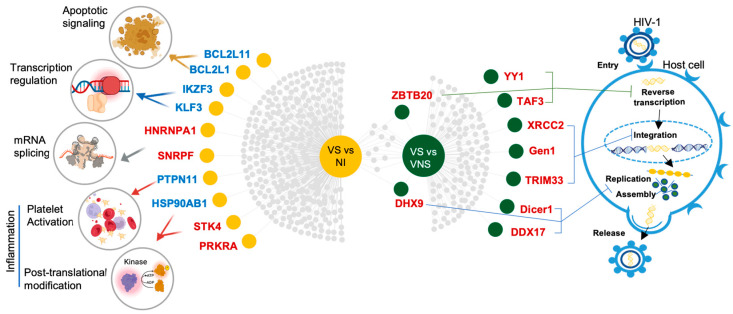
Combination antiretroviral therapy (ART) suppresses detectible HIV-1 replication, but latent reservoirs and persistent immune activation contribute to residual viral-associated morbidities and potential viral reactivation. youth with HIV (YWH) virally suppressed on ART early in infection before CD4 T cell decline with fewer comorbidities compared to adults represent a critical population for identifying markers associated with viral control and predictors of viral breakthrough. This study employed a multi-omics approach to evaluate plasma biomarkers and cellular gene expression profiles in 52 participants, including 27 YWH on ART for 144 weeks and 25 youth with no infection (NI) (ages 18-24). Among the 27 YWH, 19 were virally suppressed (VS; <50 RNA copies/mL), while eight were non-suppressed (VNS; >50 RNA copies/mL). VS YWH displayed unique bioprofiles distinct from either VNS or NI. Early viral suppression mitigates inflammatory pathways and normalizes key biomarkers associated with HIV-related comorbidities. Genes upregulated in pathways linked to cellular homeostasis such as DNA repair, RNA processing, and transcription regulation may diminish viral breakthrough and maintain sustained HIV control on ART. Candidate markers and putative molecular mechanisms were identified, offering potential therapeutic targets to limit viral persistence, enhance HIV treatment strategies, and pave the way for improved clinical outcomes.
Trial registration: ClinicalTrials.gov NCT00491556 NCT00683579.
Keywords: DNA repair; biomarkers; bioprofiles; cellular homeostasis; comorbidities; inflammation; transcriptome; viral suppression; youth with HIV.
Conflict of interest statement
The authors declare that they have no competing interests.
Figures
Similar articles
-
Anti-inflammatory effects of recreational marijuana in virally suppressed youth with HIV-1 are reversed by use of tobacco products in combination with marijuana.Retrovirology. 2022 May 31;19(1):10. doi: 10.1186/s12977-022-00594-4. Retrovirology. 2022. PMID: 35642061 Free PMC article.
-
Cell-Associated HIV-1 Unspliced-to-Multiply-Spliced RNA Ratio at 12 Weeks of ART Predicts Immune Reconstitution on Therapy.mBio. 2021 Mar 9;12(2):e00099-21. doi: 10.1128/mBio.00099-21. mBio. 2021. PMID: 33688002 Free PMC article.
-
Short Intracellular HIV-1 Transcripts as Biomarkers of Residual Immune Activation in Patients on Antiretroviral Therapy.J Virol. 2016 May 27;90(12):5665-5676. doi: 10.1128/JVI.03158-15. Print 2016 Jun 15. J Virol. 2016. PMID: 27030274 Free PMC article.
-
Tenofovir Has Minimal Effect on Biomarkers of Bone Health in Youth with HIV Receiving Initial Antiretroviral Therapy.AIDS Res Hum Retroviruses. 2019 Aug;35(8):746-754. doi: 10.1089/AID.2018.0270. Epub 2019 Jun 27. AIDS Res Hum Retroviruses. 2019. PMID: 31115244 Free PMC article.
-
Posttranscriptional Regulation of HIV-1 Gene Expression during Replication and Reactivation from Latency by Nuclear Matrix Protein MATR3.mBio. 2018 Nov 13;9(6):e02158-18. doi: 10.1128/mBio.02158-18. mBio. 2018. PMID: 30425153 Free PMC article.
Cited by
-
The Role of Microarray in Modern Sequencing: Statistical Approach Matters in a Comparison Between Microarray and RNA-Seq.BioTech (Basel). 2025 Jul 5;14(3):55. doi: 10.3390/biotech14030055. BioTech (Basel). 2025. PMID: 40700137 Free PMC article.
References
-
- Cohn L.B., da Silva I.T., Valieris R., Huang A.S., Lorenzi J.C.C., Cohen Y.Z., Pai J.A., Butler A.L., Caskey M., Jankovic M., et al. Clonal CD4(+) T cells in the HIV-1 latent reservoir display a distinct gene profile upon reactivation. Nat. Med. 2018;24:604–609. doi: 10.1038/s41591-018-0017-7. - DOI - PMC - PubMed
-
- Dubé M., Tastet O., Dufour C., Sannier G., Brassard N., Delgado G.G., Pagliuzza A., Richard C., Nayrac M., Routy J.P., et al. Spontaneous HIV expression during suppressive ART is associated with the magnitude and function of HIV-specific CD4(+) and CD8(+) T cells. Cell Host Microbe. 2023;31:1507–1522.e1505. doi: 10.1016/j.chom.2023.08.006. - DOI - PMC - PubMed
Publication types
MeSH terms
Substances
Associated data
Grants and funding
- U01 HD040533/HD/NICHD NIH HHS/United States
- U01 HD040474/HD/NICHD NIH HHS/United States
- UL1 RR025780/RR/NCRR NIH HHS/United States
- 5P30-AI064518/Duke University Center for AIDS Research
- UL1 RR024131/RR/NCRR NIH HHS/United States
- R01 DA031017/DA/NIDA NIH HHS/United States
- U01 DA044571/DA/NIDA NIH HHS/United States
- NIAID/NIH Intramural Research Program
- U01-DA044571/GF/NIH HHS/United States
- P30 AI064518/AI/NIAID NIH HHS/United States
- R01-DA031017/GF/NIH HHS/United States
- U01-HD040533/GF/NIH HHS/United States
- M01 RR010284/RR/NCRR NIH HHS/United States
- U01-HD040474/GF/NIH HHS/United States
- UL1 RR024134/RR/NCRR NIH HHS/United States
- M01 RR020359/RR/NCRR NIH HHS/United States
- U01 AI068632/AI/NIAID NIH HHS/United States
LinkOut - more resources
Full Text Sources
Medical
Research Materials
