. 2025 Feb 19;14(4):314.
doi: 10.3390/cells14040314.

A Critical Role of Intracellular PD-L1 in Promoting Ovarian Cancer Progression

Affiliations

A Critical Role of Intracellular PD-L1 in Promoting Ovarian Cancer Progression

Rui Huang et al. Cells. .

Abstract

Disrupting the interaction between tumor-cell surface PD-L1 and T cell membrane PD-1 can elicit durable clinical responses. However, only about 10% of ovarian cancer patients respond to PD-1/PD-L1 blockade. Here, we show that PD-L1 expression in ovarian cancer-patient tumors is predominantly intracellular. Notably, PARP inhibitor treatment highly increased intracellular PD-L1 accumulation in both ovarian cancer-patient tumor samples and cell lines. We investigated whether intracellular PD-L1 might play a critical role in ovarian cancer progression. Mutating the PD-L1 acetylation site in PEO1 and ID8Brca1-/- ovarian cancer cells significantly decreased PD-L1 levels and impaired colony formation, which was accompanied by cell cycle G2/M arrest and apoptosis induction. PEO1 and ID8Brca1-/- tumors with PD-L1 acetylation site mutation also exhibited significantly reduced growth in mice. Furthermore, targeting intracellular PD-L1 with a cell-penetrating antibody effectively decreased ovarian tumor-cell intracellular PD-L1 level and induced tumor-cell growth arrest and apoptosis, as well as enhanced DNA damage and STING activation, both in vitro and in vivo. In conclusion, we have shown the critical role of intracellular PD-L1 in ovarian cancer progression.

Keywords: intracellular PD-L1; ovarian cancer; progression.


Conflict of interest statement

The cell-penetrating antibody technology patent has been licensed to Inova through City of Hope. H.Y. is a co-inventor on the patent. The other authors have no conflicts of interest declared.

Figures

Figure 1
Figure 1
Intracellular PD-L1 accumulation in ovarian cancer-patient tumor samples and cell lines after PARPi treatment. (A) Immunofluorescence staining of normal ovary, primary tumor, and metastatic tissues from an ovarian cancer patient. PD-L1 staining is shown in red; pan-cytokeratin is shown in purple as a tumor marker, E-cadherin is shown in green as a cellular membrane marker, and nuclear DAPI staining is shown in blue. Scale bar, 10 μm. (B) Representative images of immunofluorescence staining of ovarian cancer-patient tumor samples before and after PARPi treatment. PD-L1 staining is shown in red; pan-cytokeratin is shown in purple as a tumor marker, E-cadherin is shown in green as a cellular membrane marker, and nuclear Hoechst staining is shown in blue. Scale bar, 10 μm. The bar graphs show the results of the statistical analysis for the quantification of PD-L1 levels in 3 pairs of ovarian cancer-patient tumor samples before and after PARPi treatment. Data are shown as the means ± SEMs, and Student’s t-test was used for statistical analysis. (**** p < 0.0001). (C) Immunofluorescence staining of PD-L1 in human and mouse ovarian cancer-cell lines PEO1, ID8Brca1−/−, and OVCAR8 following treatment with or without olaparib. Cells were cultured in growth media with 0.1% DMSO or 20 µM olaparib for 48 h. Red, PD-L1; blue, nucleus. Scale bar, 10 µm. All three cell lines presented significantly greater amounts of cytoplasmic and nuclear PD-L1 staining following olaparib treatment, compared to DMSO control treatment.
Figure 2
Figure 2
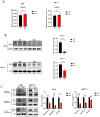
Acetylation site mutation decreases intracellular and surface levels of PD-L1 and induces PD-L1 protein degradation. (A) RNA levels of CD274 (PD-L1 gene) in PEO1 and ID8Brca1−/− cells overexpressing WT or Mut PD-L1. (ns= non-significant) (B) Western blot analysis of PD-L1 in PEO1 and ID8Brca1−/− cells overexpressing WT or Mutant PD-L1. The bar graphs show the results of the statistical analysis of triplicate lysate samples from 3 independent experiments. The data are shown as the means ± SEMs, and Student’s t-test was used for statistical analysis. (** p < 0.01). (C) Western blot analysis of membrane, cytoplasmic, and nuclear fractions derived from PEO1 and ID8Brca1−/− PD-L1 WT or Mut cells. Na-K ATPase, GAPDH, and H2AX were loading controls for each compartment. The bar graphs show the results of the statistical analysis of triplicate lysate samples from 3 independent experiments. The data are shown as means ± SEMs, and Student’s t-test was used for statistical analysis. (* p < 0.05, ** p < 0.01).
Figure 3
Figure 3
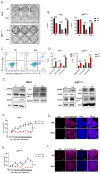
Acetylation site mutation suppresses ovarian cancer progression in vitro and inhibits tumor growth in vivo. (A) Representative image of colony formation assay of WT and Mut PEO1 and ID8Brca1−/−. Cells (500–3000) were seeded in triplicate in 6-well plates, incubated for 7 days, and then stained with crystal violet. (B) Cell cycle analysis of WT and Mut PEO1 and ID8Brca1−/− cells. The data are shown as means ± SEMs, and Student’s t-test was used for statistical analysis (n = 3, *** p < 0.001). (C) Representative flow cytometry analysis of annexin-V and PI staining as indicators of apoptosis in WT and Mut PEO1 cells. (D) Flow cytometry analysis of cell counts of early apoptotic (PI-, Annexin-V+) and late apoptotic (PI+, Annexin-V+) cells in WT and Mut PEO1 and ID8Brca1−/−. Data are shown as means ± SEMs, and Student’s t-test was used for statistical analysis (n = 3, ** p < 0.01, *** p < 0.001). (E) Western blot analysis of STING, pSTING, γH2AX, p21, caspase-3 (cas-3) and cleaved-caspase3 (cleaved cas-3) in WT or Mut PEO1 cells and ID8Brca1−/− cells. GAPDH or actin was used as loading controls. (F,H) NSG mice were injected with 5 × 10⁶ WT or Mut PEO1 and ID8Brca1−/− cells in right flanks. The tumor size was recorded twice a week. Data are shown as the means ± SEMs, and two-way ANOVA was used for statistical analysis (n = 5, *** p < 0.001). (G,I) Representative images of immunofluorescence staining of Ki67 in mouse xenograft tumor tissues from (F,H), Ki67 is shown in green (G) or red (I), pan-cytokeratin is shown in purple as a tumor marker, and nuclear Hoechst staining is shown in blue. Scale bar, 20 µm.
Figure 4
Figure 4
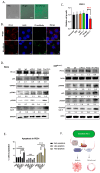
Targeting intracellular PD-L1 inhibits tumor progression and induces DNA damage and STING activation. (A) Microscope images showing that PS-α-PD-L1 antibody labeled with fluorescein (FITC) penetrated PEO1 cells. Scale bar, 50 µm. (B) PS-α-PD-L1 antibody (green) targeted PD-L1 (red color) inside tumor cells and decreased PD-L1 protein level PEO1 cells. Nuclear DAPI staining is shown in blue. Scale bar, 10 µm. (C) Viability analysis of PEO1 cells treated with PS-α-PD-L1 antibody. Cells were treated with PBS, IgG, α-PD-L1, PS-IgG, and PS-α-PD-L1 for 5 days, and cell viability was determined via cell titer glow assay. The data are expressed as the means ± SEM, and one-way ANOVA and Student’s t-test were used for statistical analysis (n = 3, *** p < 0.001). (D) Western blot analysis of PD-L1, pSTING, γH2AX, P21, and cleaved-cas3 after treatment with PBS, IgG, α-PD-L1, PS-IgG, or PS-α-PD-L1 for 3 days, in PEO1 and ID8Brca1−/− cells. GAPDH or actin was used as a loading control. The samples derive from the same experiment and gels/blots were processed in parallel. Quantification of target protein levels relative to loading control is labeled below the lanes. (E) Flow cytometry analysis of cell counts of early apoptotic (PI-, Annexin-V+) and late apoptotic (PI+, Annexin-V+) cells in PEO1 cells treated with PBS, IgG, α-PD-L1, PS-IgG, or PS-α-PD-L1 for 5 days. Data are shown as the means ± SEMs, and one-way ANOVA and Student’s t-test were used for statistical analysis (n = 3, *** p < 0.001). (F) Schematic diagram of the proposed mechanism based on the study. The solid line indicates direct effect, and the dashed line indicates indirect effect.
Figure 5
Figure 5
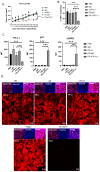
Blocking intracellular PD-L1 with PS-α-PD-L1 antibody inhibits ovarian tumor growth in vivo. (A) Mouse ID8Brca1−/− ovarian tumors overexpressing PD-L1 (subcutaneously) were allowed to grow until they reached approximately 100 mm3 prior to treatment initiation (day 7). Mice were given PBS, or 100 µg of the following antibodies: IgG, α-PD-L1, PS-IgG, or PS-α-PD-L1, three times per week for a total of six treatments (black arrow). Tumor size was measured and is presented as the means ± SEMs (n = 5). Two-way ANOVA was used for statistical analysis. *** p < 0.001. (B) Quantification of Ki67+ cells in tumor areas in mouse xenograft tumor tissues from (A). Data are shown as the means ± SD; one-way ANOVA and Student’s t-test were used for statistical analysis (*** p < 0.001). (C) Bar graphs show the results of the statistical analysis for the quantification of tumor PD-L1, p21, and γH2AX levels in mouse xenograft tumor tissues from (A). Data are shown as the means ± SDs, and one-way ANOVA and Student’s t-test were used for statistical analysis (*** p < 0.001). (D) Representative images of immunofluorescence staining of PD-L1 (red) in mouse xenograft tumor tissues from (A). Pan-cytokeratin is shown in purple as a tumor marker, and nuclear Hoechst staining is shown in blue. Scale bar, 5 µm.

References

    1. Khanlarkhani N., Azizi E., Amidi F., Khodarahmian M., Salehi E., Pazhohan A., Farhood B., Mortezae K., Goradel N.H., Nashtaei M.S. Metabolic risk factors of ovarian cancer: A review. JBRA Assist. Reprod. 2022;26:335–347. doi: 10.5935/1518-0557.20210067. - DOI - PMC - PubMed
    1. Peng Z., Li M., Li H., Gao Q. PD-1/PD-L1 immune checkpoint blockade in ovarian cancer: Dilemmas and opportunities. Drug Discov. Today. 2023;28:103666. doi: 10.1016/j.drudis.2023.103666. - DOI - PubMed
    1. Kuroki L., Guntupalli S.R. Treatment of epithelial ovarian cancer. BMJ. 2020;371:m3773. doi: 10.1136/bmj.m3773. - DOI - PubMed
    1. Hamanishi J., Mandai M., Ikeda T., Minami M., Kawaguchi A., Murayama T., Kanai M., Mori Y., Matsumoto S., Chikuma S., et al. Safety and Antitumor Activity of Anti-PD-1 Antibody, Nivolumab, in Patients with Platinum-Resistant Ovarian Cancer. J. Clin. Oncol. 2015;33:4015–4022. doi: 10.1200/JCO.2015.62.3397. - DOI - PubMed
    1. Varga A., Piha-Paul S., Ott P.A., Mehnert J.M., Berton-Rigaud D., Morosky A., Yang P., Ruman J., Matei D. Pembrolizumab in patients with programmed death ligand 1-positive advanced ovarian cancer: Analysis of KEYNOTE-028. Gynecol. Oncol. 2019;152:243–250. doi: 10.1016/j.ygyno.2018.11.017. - DOI - PubMed

Publication types