. 2025 Feb 8;53(4):gkaf130.
doi: 10.1093/nar/gkaf130.

Rescuing DNMT1 fails to fully reverse the molecular and functional repercussions of its loss in mouse embryonic stem cells

Affiliations

Rescuing DNMT1 fails to fully reverse the molecular and functional repercussions of its loss in mouse embryonic stem cells

Elizabeth Elder et al. Nucleic Acids Res. .

Abstract

Epigenetic mechanisms are crucial for developmental programming and can be disrupted by environmental stressors, increasing susceptibility to disease. This has sparked interest in therapies for restoring epigenetic balance, but it remains uncertain whether disordered epigenetic mechanisms can be fully corrected. Disruption of DNA methyltransferase 1 (DNMT1), responsible for DNA methylation maintenance, has particularly devastating biological consequences. Therefore, here we explored if rescuing DNMT1 activity is sufficient to reverse the effects of its loss utilizing mouse embryonic stem cells. However, only partial reversal could be achieved. Extensive changes in DNA methylation, histone modifications, and gene expression were detected, along with transposable element derepression and genomic instability. Reduction of cellular size, complexity, and proliferation rate were observed, as well as lasting effects in germ layer lineages and embryoid bodies. Interestingly, by analyzing the impact on imprinted regions, we uncovered 20 regions exhibiting imprinted-like signatures. Notably, while many permanent effects persisted throughout Dnmt1 inactivation and rescue, others arose from the rescue intervention. Lastly, rescuing DNMT1 after differentiation initiation worsened outcomes, reinforcing the need for early intervention. Our findings highlight the far-reaching functions of DNMT1 and provide valuable perspectives on the repercussions of epigenetic perturbations during early development and the challenges of rescue interventions.


Conflict of interest statement

None declared.

Figures

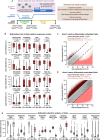
Graphical Abstract
Graphical Abstract
Figure 1.
Figure 1.
Dnmt1 inactivation and rescue permanently reduces CpG methylation levels across genomic contexts, with over 3.2 million permanently hypomethylated single CpGs. (A) Schematic diagram depicting the Dnmt1tet/tet mESC model and molecular and cellular analyses performed. Created in BioRender: Dupas, T. (2025) https://BioRender.com/a16u385. (B) Pairwise comparisons of single CpG methylation levels in Dnmt1CTL, Dnmt1INV, and Dnmt1RES (EM-seq: n = 3 per condition) relative to genomic location using the Wilcoxon rank sum test with Benjamini–Hochberg P-value adjustment. **** P-value ≤ 0.0001. (C and D) Differential methylation levels of genome-wide single CpGs in Dnmt1INV and Dnmt1RES versus Dnmt1CTL. Hypermethylated: increase ≥ 20%. Hypomethylated: decrease ≥ 20%. (E) Methylation alteration patterns of single CpGs during Dnmt1 inactivation and rescue determined by differential states in panels (C) and (D). Temporary: hypo/hyper in Dnmt1INV and stable in Dnmt1RES. Permanent: hypo/hyper in both Dnmt1INV and Dnmt1RES. Dynamic: hypo/hyper in Dnmt1INV and the opposite in Dnmt1RES. Latent: stable in Dnmt1INV and hypo/hyper in Dnmt1RES. Permanently stable: stable in both Dnmt1INV and Dnmt1RES. See also Supplementary Fig. S8A.
Figure 2.
Figure 2.
Dnmt1 inactivation and rescue in mESCs alters genome-wide histone modification landscapes. (A and B) DHMs for H3K4me3, H3K27ac, H3K4me1, H3K27me3, and H3K9me3 in Dnmt1INV and Dnmt1RES versus Dnmt1CTL measured by ChIP-seq (n = 2 per condition) and determined by a P-value ≤ 0.05 and log2 fold change ≤ −0.6 or ≥ 0.6 using the MAnorm2 software. (C) Alteration patterns of DHMs for each histone modification throughout Dnmt1 inactivation and rescue determined by their differential state in panels (A) and (B). Temporary: decrease/increase in Dnmt1INV and stable in Dnmt1RES. Permanent: decrease/increase in both Dnmt1INV and Dnmt1RES. Dynamic: decrease/increase in Dnmt1INV and the opposite in Dnmt1RES. Latent: stable in Dnmt1INV and decrease/increase in Dnmt1RES. (D and E) Frequency of DHM alteration patterns for Dnmt1INV and Dnmt1RES, respectively, representing the number of DHMs in each pattern divided by the total number of DHMs. See also Supplementary Fig. S1.
Figure 3.
Figure 3.
Permanent CpG hypomethylation is associated with specific genomic location contexts and histone modification alteration patterns. (A) Frequency of permanently hypomethylated CpGs per genomic location context. (B) Pearson’s chi-squared test associating the frequency of permanently hypomethylated CpGs with genomic location contexts. (C) Frequency of permanently hypomethylated CpGs in DHMs categorized into alteration patterns identified in Fig. 2C. (D) Pearson’s chi-squared test associating the frequency of permanently hypomethylated CpGs with DHM alteration patterns. Frequency of permanently hypomethylated CpGs represents the number of permanently hypomethylated CpGs divided by the number of methylated (methylation level ≥ 20%) CpGs in Dnmt1CTL. Pearson’s residual ≥ 2 indicates positive, < 2 but > −2 indicates neutral and ≤ −2 indicates negative association. See also Supplementary Tables S1 and S2 and Supplementary Fig. S2.
Figure 4.
Figure 4.
Analysis of known imprinted regions enables the identification of 20 regions with imprinted-like epigenetic and regulatory signatures. (A) Selection of 15 known imprinted regions based on four criteria: permanently hypomethylated CpGs ≥ 1, permanent mean CpG hypomethylation ≥ 10%, overlapping permanently decreased H3K9me3 DHMs, and located within H3K9me3 broad domains (≥ 3000 bp) in Dnmt1CTL. (B) Workflow for identifying imprinted-like regions among mESC allele-specific methylated regions based on the four criteria in panel (A). Created in BioRender: Dupas, T. (2025) https://BioRender.com/r69z354. (C) Z-score normalization of epigenetic modification levels in Dnmt1CTL, Dnmt1INV, and Dnmt1RES for selected known imprinted regions and imprinted-like regions. (D and E) Mean CpG methylation levels in oocytes versus sperm for selected known imprinted regions and imprinted-like regions, respectively. (F) ZFP57 DNA binding motif MA1583.1. (G) Enrichment of ZFP57 DNA binding motif MA1583.1 in selected known imprinted regions and imprinted-like regions. (H) Genomic signal tracks for H19, Peg13–Trappc9, and Zrsr1–Commd1 imprinted regions and Zfp13, Rnf216 upstream, and Zfp668 imprinted-like regions showing CpG methylation in gametes and Dnmt1tet/tet mESCs, H3K9me3 in Dnmt1tet/tet mESCs, Zfp57 WT and KO mESCs and Setdb1 WT and KO mESCs, ZFP57 binding in Zfp57 WT mESCs, and SETDB1 binding in Setdb1 WT mESCs. See also  Supplementary Table S3 and Supplementary Fig. S3 and S4.
Figure 5.
Figure 5.
Permanent derepression of MERVL and MT2 LTRs may be linked to gene transcript chimerism. (A) Frequency of permanently hypomethylated CpGs in the most abundant LTR families and in high-occupancy LTRs (genomic occurrences ≥ 500). (B and C) Change in mean CpG methylation levels (EM-seq) and log2 fold change of total RNA-seq normalized counts, respectively, of high-occupancy LTRs in Dnmt1INV and Dnmt1RES versus Dnmt1CTL (EM-seq: n = 3, RNA-seq: n = 2 per condition). (D and E) Pairwise comparisons of MERVL-int locus-specific mean CpG methylation levels and RNA-seq normalized counts in Dnmt1CTL, Dnmt1INV, and Dnmt1RES using the Wilcoxon rank sum test with Benjamini–Hochberg P-value adjustment. ** P-value ≤ 0.01, **** P-value ≤ 0.0001. (F and G) Pairwise comparisons of MT2-Mm locus-specific mean CpG methylation levels and RNA-seq normalized counts in Dnmt1CTL, Dnmt1INV, and Dnmt1RES using the Wilcoxon rank sum test with Benjamini–Hochberg P-value adjustment. (H and I) Z-score normalization of locus-specific CpG methylation level and RNA-seq normalized count for MERVL-int and MT2_Mm. (J) Genomic signal tracks showing CpG methylation and RNA expression for MERVL-int and MT2-Mm loci proximal to TSSs. See also Supplementary Table S5.
Figure 6.
Figure 6.
Gene expression dysregulation, genomic instability, and altered cellular processes. (A and B) Differentially expressed genes in Dnmt1INV and Dnmt1RES versus Dnmt1CTL determined by an adjusted P-value ≤ 0.05 and log2 fold change ≤ −0.6 or ≥ 0.6 using mRNA sequencing (n = 3 per condition) analyzed with the DESeq2 software. (C) Notable genes with stable expression in Dnmt1INV and Dnmt1RES versus Dnmt1CTL. (D) GSEA for down- and upregulated genes in Dnmt1INV and Dnmt1RES. (E) Signal enrichment of H3K4me3 and H3K27me3 in Dnmt1CTL, Dnmt1INV, and Dnmt1RES at TSSs of PRC2/SUZ12/EED nonredundant targets exhibiting gene expression dysregulation in Dnmt1INV and/or Dnmt1RES identified in panel (D). RPKM values were scaled between 0 and 0.99 quantiles to mitigate the presence of outliers. (F) Genomic signal tracks showing CpG methylation, H3K4me3, H3K27me3, and mRNA expression for PRC2/SUZ12/EED targets Fos and Nkx2-9 in Dnmt1CTL, Dnmt1INV, and Dnmt1RES. (G) Pairwise comparisons of relative telomere length in Dnmt1CTL, Dnmt1INV, and Dnmt1RES measured by qPCR and the delta-delta Ct method, with normalization to reference single-copy gene Rplp0 and relativization to reference DNA from R1 mESCs (n = 8 per condition). (H–  J) Pairwise comparisons of the percentage of γH2AX-positive live cells (DNA damage), live-cell mean forward scatter area (FSC-A; cell size), live-cell mean side scatter area (SSC-A; cell granularity i.e. internal complexity), respectively, in Dnmt1CTL, Dnmt1INV, and Dnmt1RES measured by FACS (n = 3 per condition). (K) Pairwise comparisons of cell proliferation rate for Dnmt1CTL, Dnmt1INV, and Dnmt1RES measured by the increase in confluency over 30 h (n = 3 per condition). All pairwise comparisons were conducted using one-way ANOVA with Tukey’s HSD test with P-value adjustment. ns P-value > 0.05, * P-value ≤ 0.05, ** P-value ≤ 0.01, *** P-value ≤ 0.001, **** P-value ≤ 0.0001. See also Supplementary Tables S6 and S7 and Supplementary Fig. S6 and S7.
Figure 7.
Figure 7.
Lasting effects on gene expression patterns upon differentiation to embryonic germ layers. (A) Schematic diagram depicting Dnmt1CTL and Dnmt1RES differentiation into germ layer monolayers (n = 3 per differentiation). Created in BioRender: Dupas, T. (2025) https://BioRender.com/y05v644. (B) Differential gene expression in Dnmt1RES versus Dnmt1CTL endoderm, mesoderm and ectoderm determined by an adjusted P-value ≤ 0.05 and log2 fold change ≤ −0.6 or ≥ 0.6 using mRNA sequencing (n = 3 per differentiation) analyzed with the DESeq2 software. (C) GSEA for down- and upregulated genes in Dnmt1RES germ layers. (D) Total number of differentially expressed genes in Dnmt1RES cell types. (E and F) Overlap of downregulated and upregulated genes among Dnmt1RES cell types. See also Supplementary Table S6 and Supplementary Fig. S7.
Figure 8.
Figure 8.
Delaying Dnmt1 rescue until after differentiation initiation worsens molecular and cellular outcomes. (A) Schematic diagram depicting embryoid body formation including four experimental conditions: Dnmt1-control, Dnmt1-inactive, Dnmt1-rescue, and post-differentiation Dnmt1-rescue. Embryoid bodies (n = 192 per condition) were derived from the same Dnmt1tet/tet mESC culture. Created in BioRender: Dupas, T. (2025) https://BioRender.com/f72a244. (B) Bright-field microscopy images of one embryoid body per condition taken on days 3, 5, 7, and 10. (C) Size and (D) circularity of embryoid bodies on days 2, 5, and 10 determined by measuring their surface area and perimeter on bright-field microscopy images using the ImageJ software. Daily images were taken of the same 20 embryoid bodies per condition. Surface area was used as an indicator of size and circularity was calculated with the formula 4π × Area/Perimeter². (E) Principal component analysis of gene expression measured on day 5 and day 10 by mRNA sequencing (n = 3 per condition with pooled embryoid bodies). A greater divergence in gene expression profiles is represented by the distance between samples along the x-axis (PC1), compared to the y-axis (PC2). (F) Number of differentially expressed genes in Dnmt1-inactive, Dnmt1-rescue, and post-differentiation Dnmt1-rescue embryoid bodies versus Dnmt1-control embryoid bodies on day 5 and day 10 determined by an adjusted P-value ≤ 0.05 and log2 fold change ≤ −0.6 or ≥ 0.6 using mRNA sequencing analyzed with the DESeq2 software. (G) Estimated proportion of ExE endoderm, epiblast (pluripotent), primitive streak (mesendoderm), and neurectoderm cell types in embryoid bodies on days 5 and 10 determined by deconvoluting raw counts using single-cell data from mouse gastrulation embryos (embryonic day 7.75). All pairwise comparisons were conducted using one-way ANOVA with Tukey’s HSD test and P-value adjustment. ns P-value > 0.05, * P-value ≤ 0.05, ** P-value ≤ 0.01, *** P-value ≤ 0.001, **** P-value ≤ 0.0001. See also Supplementary Fig. S8.

References

    1. Gibney ER, Nolan CM Epigenetics and gene expression. Heredity. 2010; 105:4–13.10.1038/hdy.2010.54. - DOI - PubMed
    1. Jenuwein T, Allis CD Translating the histone code. Science. 2001; 293:1074–80.10.1126/science.1063127. - DOI - PubMed
    1. Breton-Larrivée M, Elder E, McGraw S DNA methylation, environmental exposures and early embryo development. Anim Reprod. 2019; 16:465–74.10.21451/1984-3143-AR2019-0062. - DOI - PMC - PubMed
    1. Li E Chromatin modification and epigenetic reprogramming in mammalian development. Nat Rev Genet. 2002; 3:662–73.10.1038/nrg887. - DOI - PubMed
    1. Amstislavsky SY, Kizilova EA, Golubitsa AN et al. . Preimplantation exposures of murine embryos to estradiol or methoxychlor change postnatal development. Reprod Toxicol. 2004; 18:103–8.10.1016/j.reprotox.2003.10.008. - DOI - PubMed

Substances

LinkOut - more resources