. 2025 Feb 1;11(2):110.
doi: 10.3390/jof11020110.

Echinocandin Adaptation in Candida albicans Is Accompanied by Altered Chromatin Accessibility at Gene Promoters and by Cell Wall Remodeling

Affiliations

Echinocandin Adaptation in Candida albicans Is Accompanied by Altered Chromatin Accessibility at Gene Promoters and by Cell Wall Remodeling

Sudisht K Sah et al. J Fungi (Basel). .

Abstract

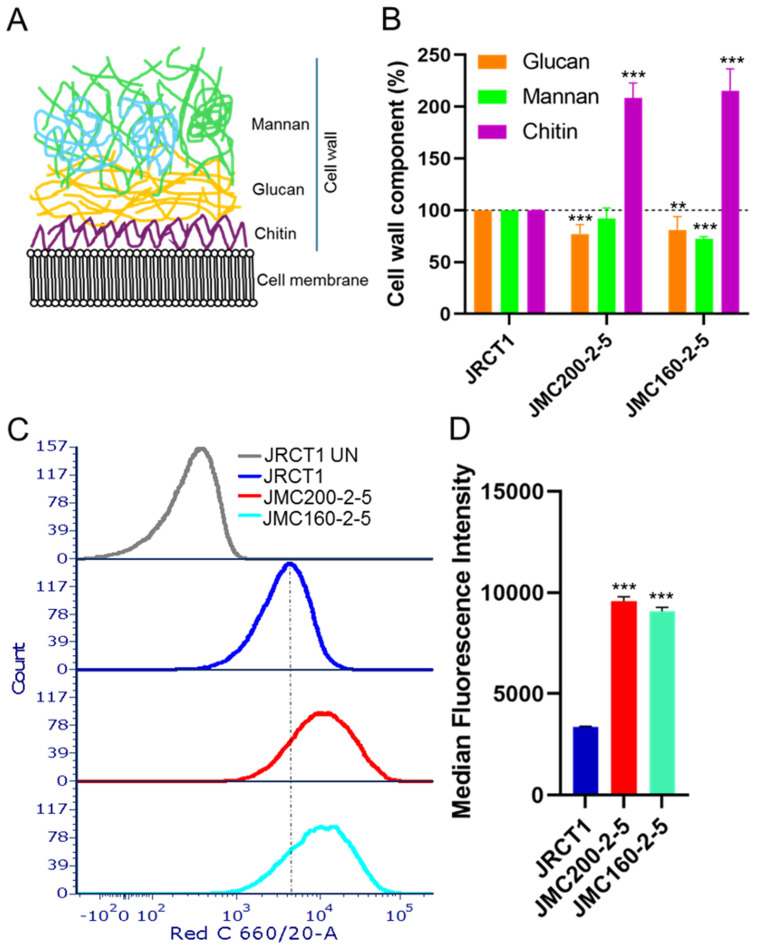
Infections by the major opportunistic pathogen of human Candida albicans are commonly treated with echinocandin (ECN) drugs. However, C. albicans can adapt to grow in the presence of certain amounts of ECNs. Prior studies by several laboratories have defined multiple genes, as well as mechanisms involving induced aneuploidy, that can govern this. Still, the mechanisms of ECN adaptation are not fully understood. Here, we use genome-wide profiling of chromatin accessibility by ATAC-seq to determine if ECN adaptation is reflected in changes in the chromatin landscape in the absence of aneuploidy. We find that drug adaptation is coupled with multiple changes in chromatin accessibility genome-wide, which occur predominantly in gene promoter regions. Areas of increased accessibilities in promoters are enriched with the binding motifs for at least two types of transcription factors: zinc finger and basic leucine zipper. We also find that chromatin changes are often associated with differentially expressed genes including genes with functions relevant to the ECN-adapted phenotype, such as cell wall biosynthesis. Consistent with this, we find that the cell wall is remodeled in ECN-adapted mutants, with chitin up and glucan down and increased cell surface exposure. A full understanding of ECN adaptation processes is of critical importance for the prevention of clinical resistance.

Keywords: ATAC-seq; Candida albicans; echinocandin adaptation.


Conflict of interest statement

The authors declare no conflicts of interest.

Figures

Figure 1
Figure 1
Characteristics of significant ATAC-seq peaks in ECN-adapted mutants JMC200-2-5 and JMC160-2-5 vs. parental strain JRCT1: (A). Distribution of ATAC-seq peaks throughout chromosomes. Red and blue tracks represent gain or loss of peaks as indicated. (B). Snapshot showing an example of IGV-track with gain of narrow peak in the promoter area of PPH21 and C7_01510W_A (red) in both adapted mutants. Presented are mutants JMC160-2-5 and JMC200-2-5, parental JRCT1, and control gDNA, as indicated. See Figure S1 for examples of the gain of broad peaks, as well as a loss of narrow and broad peaks in PGA25, PGA63, LSP1, ECM21, PHO87, CAN2, GLC3, BMT7, MKC1, FUN31, CRZ1, RIM101, CUP9, and CHS1.
Figure 2
Figure 2
Volcano plots of Narrow and Broad ATAC-seq peaks in ECN-adapted mutants JMC200-2-5 and JMC160-2-5 vs. parental strain JRCT1, as indicated. The y-axis represents the negative log10 adjusted p-values (false discovery rate, FDR). The x-axis represents the log2 fold change between parent and mutant. The horizontal dashed line indicates FDR equal to 0.05. Each dot represents a peak annotated to the nearest gene. Red stands for lost peaks, while green stands for gained peaks. Black dots indicate 16 caspofungin responsive and cell wall build genes. Images were generated using GraphPad Prism version 9.5.0 for Windows.
Figure 3
Figure 3
Pie chart showing the distribution of significant ATAC-seq peaks over different genomic regions according to program ChIPSeeker (see Section 4).
Figure 4
Figure 4
Characteristics of ATAC-seq peaks that are found in all promoter regions of ECN-adapted mutants JMC200-2-5 and JMC160-2-5 vs. parental strain JRCT1: (A). Heat maps of all peaks according to program deepTools (see Section 4) within the range of −1000/+200 bp relative to TSS. Shown are gain (red) and loss (blue) of peaks that are clustered according to K-means clustering of differential ATAC-seq nucleosome-free read coverage (log2-fold change). Note that ATAC-seq reads are split into clusters 1, 2, 3, and 4 of which the top cluster is enriched with gain of peaks. (B). Average plot of each cluster of both mutants.
Figure 5
Figure 5
Mutants JMC200-2-5 and JMC160-2-5 share 116 DEGs having 122 ATAC-seq peaks. Shown are Venn diagrams for a total of 629 shared peaks between two mutants (A) and 122 shared peaks that correspond to 116 shared DEGs (B). In (B), intersection areas of diagrams present numbers of shared genes that have peaks. See also Tables S15–S18 for 116 DEGs having 122 ATAC-seq peaks.
Figure 6
Figure 6
(A) Pie charts depict the distribution of 122 ATAC-seq peaks that are found in 116 DEGs common between CAS-adapted mutants JMC200-2-5 and JMC160-2-5. (B) Distribution of peaks corresponds to 16 DEGs involved in caspofungin and cell wall remodeling. Note that peaks are found in each DEG, as presented in Tables S15–S18. Some DEGs have multiple peaks. Shown is the distribution of Narrow and Broad peaks over five regions: transcription start site (TSS), up to 1kb upstream and downstream of TSS, and more than 1 kb up or downstream of TSS. Note the substantial difference in distribution between Narrow and Broad peaks. While the majority of Narrow peaks originate at up to 1kb upstream of TSS, the majority of Broad peaks originate at TSS.
Figure 7
Figure 7
Logos of position weight matrices showing motifs binding sites enriched in differentially accessible TF binding regions from narrow peaks in JMC200-2-5 and JMC160-2-5. The number of matched target sequences as well as the q-value (Benjamini) is indicated in each motif. Top panel increased accessibility and bottom panel decreased accessibility as indicated.
Figure 8
Figure 8
ECN-adapted mutants have remodeled cell walls: (A). Cartoon showing three major components of the cell wall: mannan, glucan, and chitin. Mannosylated proteins are represented in blue. (B). Changes in mannan, glucan, and chitin amounts of the cell wall in ECN-adapted mutants. Measurements were performed with at least two biological replicates, each replicates with two technical replicates. The amount of glucan, mannan, and chitin in parental strain is set as 100%. The asterisks indicate a p value of <0.01 (**), or <0.001 (***), as determined using Student’s t-test. (C). Increased glucan surface exposure in ECN-adapted mutants was measured with FACS using hDectin-1a and anti-IgG antibody conjugated with Alexa Fluor 647. Shown is a representative histogram of at least a 104 singlet population of caspofungin-adapted mutants in red C channel. JRCT1 UN stands for unstained control. Note that peaks of both mutants JMC200-2-5 and JMC160-2-5 shifted to the right, indicating increased fluorescence as compared with parental JRCT1. (D). Bar graph presentation of median fluorescence intensity of each mutant from three biological repeats. The asterisks indicate a p value of <0.001 (***), as determined using Student’s t-test.

Similar articles

References

    1. Fisher M.C., Gurr S.J., Cuomo C.A., Blehert D.S., Jin H., Stukenbrock E.H., Stajich J.E., Kahmann R., Boone C., Denning D.W., et al. Threats Posed by the Fungal Kingdom to Humans, Wildlife, and Agriculture. mBio. 2020;11:e00449-20. doi: 10.1128/mBio.00449-20. - DOI - PMC - PubMed
    1. Kainz K., Bauer M.A., Madeo F., Carmona-Gutierrez D. Fungal infections in humans: The silent crisis. Microb. Cell. 2020;7:143–145. doi: 10.15698/mic2020.06.718. - DOI - PMC - PubMed
    1. Almeida F., Rodrigues M.L., Coelho C. The Still Underestimated Problem of Fungal Diseases Worldwide. Front. Microbiol. 2019;10:214. doi: 10.3389/fmicb.2019.00214. - DOI - PMC - PubMed
    1. Fisher M.C., Denning D.W. The WHO fungal priority pathogens list as a game-changer. Nat. Rev. Microbiol. 2023;21:211–212. doi: 10.1038/s41579-023-00861-x. - DOI - PMC - PubMed
    1. Lee Y., Puumala E., Robbins N., Cowen L.E. Antifungal Drug Resistance: Molecular Mechanisms in Candida albicans and Beyond. Chem. Rev. 2021;121:3390–3411. doi: 10.1021/acs.chemrev.0c00199. - DOI - PMC - PubMed

LinkOut - more resources