

Longitudinal Displacement for Left Ventricular Function Assessment
- PMID: 39997487
- PMCID: PMC11856874
- DOI: 10.3390/jcdd12020053
Longitudinal Displacement for Left Ventricular Function Assessment
Abstract
Background: Quantitative evaluation of myocardial function traditionally relies on parameters such as ejection fraction and strain. Strain, reflecting the relative change in the length of a myocardial segment over the cardiac cycle, has been extensively studied in various cardiac pathologies over the past two decades. However, the absolute length change, or longitudinal displacement, of myocardial segments during the cardiac cycle has received limited attention. This study aims to evaluate longitudinal displacement in two separate groups: healthy athletes and patients with left ventricular dysfunction, providing new insights into myocardial function assessment.
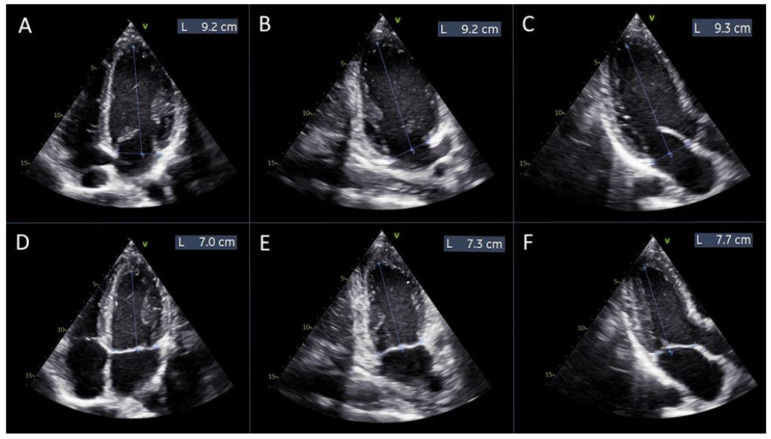
Methods: Echocardiographic examinations were performed on 30 healthy football players and 30 patients with left ventricular dysfunction using speckle-tracking imaging analysis. Global and regional peak longitudinal displacement values were calculated and compared with corresponding global and regional peak longitudinal strain measurements. A manual alternative for calculating global longitudinal strain was also proposed.
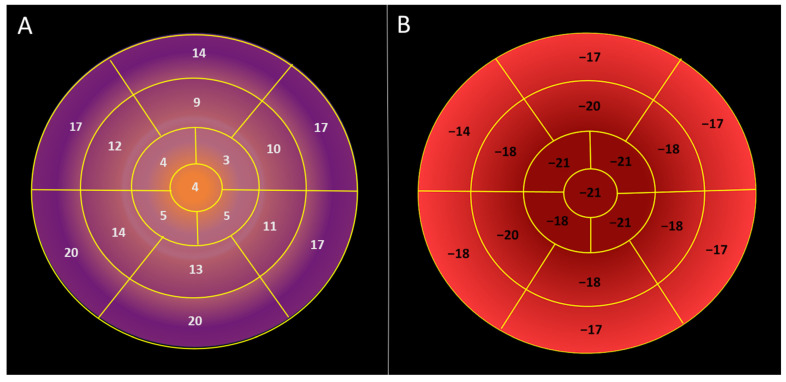
Results: An inverse correlation was found between regional longitudinal displacement and regional longitudinal strain. Longitudinal displacement was maximal in the basal segments and lowest in the apex of the left ventricle, exhibiting a reversed basal-to-apical gradient (17.6 ± 3.5 mm vs. 11.5 ± 2.9 mm vs. 4.22 ± 1.7 mm in basal, mid, and apical segments, respectively; p < 0.000001). Maximal longitudinal displacement was observed in the inferior and posterior walls of the left ventricle. In the 30 patients with left ventricular dysfunction, global longitudinal displacement was significantly lower than in healthy individuals (4.4 ± 1.7 mm vs. 11.7 ± 1.5 mm, p < 0.000001). Global longitudinal displacement and global longitudinal strain showed a strong negative correlation (r = -0.72, p < 0.000001). Manually calculated global longitudinal strain demonstrated good agreement with speckle-tracking-based global longitudinal strain.
Conclusions: Peak longitudinal displacement can be used to evaluate both regional and global myocardial function, similarly to peak longitudinal strain. Unlike strain, longitudinal displacement exhibits a reversed basal-to-apical gradient, with the highest values at the base of the left ventricle and the lowest at the apex. Global and regional longitudinal displacement is significantly reduced in patients with left ventricular dysfunction. Global longitudinal strain can be manually calculated using displacement measurements. Further studies are needed to evaluate peak longitudinal displacement in various cardiac pathologies.
Keywords: left ventricular function; longitudinal displacement; longitudinal strain; speckle tracking imaging.
Conflict of interest statement
The authors declare no conflicts of interest.
Figures


References
-
- Lang R.M., Badano L.P., Mor-Avi V., Afilalo J., Armstrong A., Ernande L., Flachskampf F.A., Foster E., Goldstein S.A., Kuznetsova T., et al. Recommendations for cardiac chamber quantification by echocardiography in adults: An update from the American Society of Echocardiography and the European Association of Cardiovascular Imaging. Eur. Heart J. Cardiovasc. Imaging. 2015;16:233–270. doi: 10.1093/ehjci/jev014. - DOI - PubMed
-
- Lyon A.R., López-Fernández T., Couch L.S., Asteggiano R., Aznar M.C., Bergler-Klein J., Boriani G., Cardinale D., Cordoba R., Cosyns B., et al. 2022 ESC Guidelines on cardio-oncology developed in collaboration with the European Hematology Association (EHA), the European Society for Therapeutic Radiology and Oncology (ESTRO) and the International Cardio-Oncology Society (IC-OS): Developed by the task force on cardio-oncology of the European Society of Cardiology (ESC) Eur. Heart J. 2022;43:4229–4361. doi: 10.1093/eurheartj/ehac244. - DOI - PubMed
-
- Oikonomou E.K., Kokkinidis D.G., Kampaktsis P.N., Amir E.A., Marwick T.H., Gupta D., Thavendiranathan P. Assessment of Prognostic Value of Left Ventricular Global Longitudinal Strain for Early Prediction of Chemotherapy-Induced Cardiotoxicity: A Systematic Review and Meta-analysis. JAMA Cardiol. 2019;4:1007–1018. doi: 10.1001/jamacardio.2019.2952. - DOI - PMC - PubMed
-
- Marwick T.H., Dewar E., Nolan M., Shirazi M., Dias P., Wright L., Fitzgerald B., Kearney L., Srivastava P., Atherton J., et al. Strain surveillance during chemotherapy to improve cardiovascular outcomes: The SUCCOUR-MRI trial. Eur. Heart J. 2024;45:4414–4424. doi: 10.1093/eurheartj/ehae574. - DOI - PMC - PubMed
LinkOut - more resources
Full Text Sources
Miscellaneous
