. 2025 Mar 19;91(3):e0219224.
doi: 10.1128/aem.02192-24. Epub 2025 Feb 25.

A strain of Streptococcus mitis inhibits biofilm formation of caries pathogens via abundant hydrogen peroxide production

Affiliations

A strain of Streptococcus mitis inhibits biofilm formation of caries pathogens via abundant hydrogen peroxide production

Isabella Williams et al. Appl Environ Microbiol. .

Abstract

Commensal oral streptococci that colonize supragingival biofilms deploy mechanisms to combat competitors within their niche. Here, we determined that Streptococcus mitis more effectively inhibited biofilm formation of Streptococcus mutans compared to other oral streptococci. This phenotype was common among all isolates of S. mutans, but was specific to a single strain of S. mitis, ATCC 49456. We documented ATCC 49456 to accumulate four to five times more hydrogen peroxide (H2O2) than other Streptococcus species tested, and 5-18 times more than other S. mitis strains assayed. S. mutans biofilm formation inhibition was dependent on cell contact/proximity and reduced when grown in media containing catalase or with a S. mitis mutant of pyruvate oxidase (spxB; pox), confirming that SpxB-dependent H2O2 production was a major antagonistic factor. Addition of S. mitis within hours after S. mutans inoculation was effective at reducing biofilm biomass, but not for 24 h pre-formed biofilms in an SpxB-dependent manner. Transcriptome analysis revealed responses for both S. mitis and S. mutans, with several S. mutans differentially expressed genes following a gene expression pattern we have previously described, while others being unique to the interaction with S. mitis. Finally, we show that S. mitis also affected coculture biofilm formation of several other commensal streptococci as well as cariogenic Streptococcus sobrinus. Our study shows that strains with abundant H2O2 production are effective at inhibiting initial growth of caries pathogens like S. mutans, but are less effective at disrupting pre-formed biofilms and have the potential to influence the stability of other oral commensal strains.IMPORTANCEAntagonistic properties displayed by oral bacteria have been sought as therapeutic approaches against dental caries pathogens like Streptococcus mutans. An emergent theme has been the ability of select strains that produce high amounts of hydrogen peroxide to effectively inhibit the growth of S. mutans within in vitro and in vivo models. Our study builds on these previous findings by determining that Streptococcus mitis ATCC 49456 is a high hydrogen peroxide producer, compared to other Streptococcus species as well as additional strains of S. mitis. In addition to S. mutans, we show that ATCC 49456 also affects biofilm formation of other oral streptococci, a non-desirable trait that should be weighed heavily for strains under consideration as probiotics. Further phenotypic characterization of strains like S. mitis ATCC 49456 in mixed-species settings will allow us to hone in on qualities that are optimal for probiotic strains that are intended to prevent the emergence of odontopathogens.

Keywords: biofilms; dental caries; hydrogen peroxide; intermicrobial interactions; oral biology.


Conflict of interest statement

The authors declare no conflict of interest.

Figures
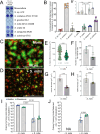
Fig 1
Fig 1
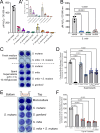
A Strain of S. mitis inhibits S. mutans biofilm formation. (A) Representative image of a CV biofilm biomass assay where S. mutans is cocultured with different oral streptococci species (listed down right y-axis) in TYGS medium. S. mutans monoculture is shown at the top for reference. (B) CV quantification (Abs 575 nm) of the experiment shown in A. Data are expressed as the percentage of biomass formed in comparison to S. mutans monoculture (i.e., monoculture values set to 100%). B’ is same data on a smaller y-axis with S. cristatus and S. sobrinus coculture data removed. n = 6. (C) Merged representative maximum intensity 40× Z-projection of 24 h S. mutans monoculture biofilm (Mono). S. mutans constitutively expresses green fluorescent protein (GFP; green), eDNA was probed with labeled antibodies (yellow), and glucans were visualized with labeled dextran (red). Scale bar (100 µm) is shown in the bottom right corner. (D) Merged representative maximum intensity 40× Z-projection of 24 h S. mutans cocultured biofilm with S. mitis (+S. mitis). (E) Quantification of individual S. mutans microcolony volumes, (F) number of S. mutans microcolonies per field of view, (G) glucan biomass, and (H) eDNA biomass from the microscopy data shown in C and D. n = 4. Light gray bars represent S. mutans monoculture, and darker gray bars indicate coculture with S. mitis. Quantification was completed using Gen5 Image+ software. (I) S. mutans colony forming units (CFUs) returned from 24 h biofilms, with enumeration of cells in either biofilm (blue circles) or planktonic growth phase (green squares), grown with or without S. mitis. n = 4. (J) S. mitis CFUs returned. Data graphing and two-way analysis of variance with multiple comparisons or Student’s t-test were completed in GraphPad Prism software.
Fig 2
Fig 2
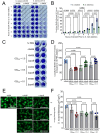
S. mutans is specifically inhibited by strain ATCC 49456. (A) CV quantification (Abs 575 nm) of biomass formed by various S. mutans isolates grown in monoculture (Mono) or in coculture with S. mitis (+ 49456). (B) Representative image of a CV biofilm biomass assay where S. mutans is cocultured with different strains of S. mitis (listed down right y-axis). (C) CV quantification (Abs 575 nm) of the experiment shown in B. Data are expressed as the percentage of biomass formed in comparison to S. mutans monoculture. Light gray bars represent S. mutans monoculture, and darker gray bars indicate coculture with S. mitis. (D) Merged representative maximum intensity 40× Z-projection of 24 h S. mutans cocultured biofilms with different strains of S. mitis (labeled in top right corner). S. mutans constitutively expresses green fluorescent protein (GFP; green), eDNA was probed with labeled antibodies (yellow), glucans were visualized with labeled dextran (red), and a total cell strain was applied to visualize S. mitis within the biofilms (Hoechst 33342; blue). Scale bar (100 µm) is shown in the bottom right corner. Arrows denote examples of S. mutans microcolonies. (E) Quantification of individual S. mutans microcolony volumes, (F) biofilm thickness, (G) glucan biomass, and (H) eDNA biomass from the microscopy data shown in D. n = 4. Quantification was completed using Gen5 Image+ software. Data graphing and one-way analysis of variance with multiple comparisons were completed in GraphPad Prism software.
Fig 3
Fig 3
High levels of hydrogen peroxide produced by strain ATCC 49456 inhibit S. mutans in close proximity. (A) Quantification of hydrogen peroxide present in culture supernatants of different oral species. Values were normalized to culture density (OD600 nm) prior to centrifugation and extraction of culture supernatants. S. mitis (ATCC 49456) is shown on the left. A’ is same data on a smaller y-axis with S. mitis data removed. n = 4. (B) Quantification of hydrogen peroxide present in culture supernatants of different S. mitis strains. (C) Representative image of a CV biofilm biomass assay where S. mutans is grown in fresh medium (above dashed line), or grown in extracted 24 h supernatants of various cultures (below dashed line, listed down right y-axis). (D) CV quantification (Abs 575 nm) of the experiment shown in C. Data are expressed as the percentage of biomass formed in comparison to S. mutans alone grown in fresh medium (Mono; i.e., monoculture values set to 100%). n = 8. Light gray bars represent S. mutans monoculture, and darker gray bars indicate coculture with S. mitis. (E) Representative image of a CV biofilm biomass assay where S. mutans is inoculated in the bottom of a Transwell, and various species are inoculated on top (listed down right y-axis). (F) CV quantification (Abs 575 nm) of the experiment shown in E. Data are expressed as the percentage of biomass formed in comparison to S. mutans alone grown in fresh medium (Mono; i.e., monoculture values set to 100%). n = 8. Data graphing and one-way analysis of variance with multiple comparisons were completed in GraphPad Prism software.
Fig 4
Fig 4
Lack of S. mitis hydrogen peroxide production reverses biofilm inhibition phenotype. (A) Quantification of hydrogen peroxide present in culture supernatants of S. mitis ATCC 49456 wild-type (49456), with (+) or without (−) addition of 100 U/mL catalase to the growth medium, and with an spxB mutant (ΔspxB) with (+) and without (−) catalase. n = 3. (B) Representative image of a CV biofilm biomass assay where S. mutans is cultured in different conditions (listed down right y-axis). (C) CV quantification (Abs 575 nm) of the experiment shown in B. Data are expressed as the percentage of biomass formed in comparison to S. mutans monoculture alone (Mono; i.e., monoculture values set to 100%). n = 8. Light gray bars represent S. mutans monoculture, and darker gray bars indicate coculture with S. mitis. (D) Merged representative maximum intensity 40× Z-projection of 24 h S. mutans biofilms grown in monoculture (Mono), in coculture with S. mitis (+ 49456), with S. mitis and addition of 100 U/mL catalase (+ 49456 + Cat), with the S. mitis spxB mutant (+ΔspxB), and the spxB mutant with addition of 100 U/mL catalase (+ΔspxB + Cat). S. mutans constitutively expresses green fluorescent protein (GFP; green), eDNA was probed with labeled antibodies (yellow), and glucans were visualized with labeled dextran (red). Scale bar (100 µm) is shown in the bottom right corner. Arrows denote examples of S. mutans microcolonies. (E) Quantification of individual S. mutans microcolony volumes, (F) biofilm thickness, (G) glucan biomass, and (H) eDNA biomass from the microscopy data shown in D. n = 4. Quantification was completed using Gen5 Image+ software. Data graphing and one-way analysis of variance with multiple comparisons were completed in GraphPad Prism software.
Fig 5
Fig 5
S. mitis impacts biofilm formation of other oral streptococci. (A) Representative image of a CV biofilm biomass assay of different oral Streptococcus species listed on the left y-axis, grown in monoculture (Mono), in coculture with S. mitis (49456), or in coculture with the spxB mutant (ΔspxB), in medium lacking (−) or containing (+) 100 U/mL catalase. (B) CV quantification (Abs 575 nm) of the experiment shown in A for strains S. cristatus 51100, S. oralis 34, and S. sobrinus 6715. Data are expressed as the percentage of biomass remaining in the S. mitis coculture condition compared to the monoculture condition (Mono), which lacks S. mitis. n = 6. Light gray bars represent monoculture, and darker gray bars indicated coculture with S. mitis. (C) Merged representative maximum intensity 40× Z-projection of 24 h S. cristatus, S. oralis, or S. sobrinus biofilms grown in monoculture (Mono), in coculture with S. mitis (49456), with the S. mitis spxB mutant (ΔspxB), in medium lacking (−) or containing (+) 100 U/mL catalase. A total cell strain was applied to visualize cells within the biofilms (Hoechst 33342; blue), eDNA was probed with labeled antibodies (yellow), and glucans were visualized with labeled dextran (red). Scale bar (100 µm) is shown in the bottom right corner. (D) Quantification of total cell biomass within each biofilm in the various conditions. Quantification was completed using Gen5 Image+ software. Data graphing and two-way analysis of variance with multiple comparisons were completed in GraphPad Prism software.
Fig 6
Fig 6
S. mitis disruption of forming and pre-formed biofilms of caries pathogens. (A) Representative image of a CV biofilm biomass assay where either fresh medium lacking inoculation of S. mitis (− 49456) or medium containing S. mitis (+ 49456) replaced the original growth medium of either S. mutans or S. sobrinus biofilms at the time point indicated on the left y-axis. 0 indicates addition during the inoculation of S. mutans or S. sobrinus. Biofilms were grown for a total of 24 h. (B) CV quantification (Abs 575 nm) of the experiment shown in A. Data are expressed as the percentage of biomass remaining in the S. mitis coculture condition compared to medium addition lacking S. mitis at each specific time point. (C) Representative image of a CV biofilm biomass assay where medium from 24 h pre-formed S. mutans biofilms is replaced with either 1× PBS, medium lacking inoculation of S. mitis (− 49456), or S. mitis ATCC 49456 wild-type (49456) or spxB mutant (ΔspxB) at different optical densities (OD600 nm = 1.0, 0.4, or 0.1). The biofilms were then grown for another 24 h prior to CV staining. (D) CV quantification (Abs 575 nm) of the experiment shown in C. Data are expressed as the percentage of biomass remaining in comparison to the 1× PBS control (i.e., biofilm formed at 24 h without additional growth). − 49456 refers to the addition of medium lacking S. mitis. n = 8. Light gray bars represent S. mutans monoculture, and darker gray bars indicated coculture with S. mitis. (E) Representative maximum intensity 40× Z-projection of 48 h S. mutans biofilms grown in the absence of (− 49456), or with the addition of S. mitis (+ 49456) or ΔspxB (+ ΔspxB) at different optical densities at 24 h. Biofilms were then grown for another 24 h prior to imaging. S. mutans constitutively expresses green fluorescent protein (GFP; green). Scale bar (100 µm) is shown in the bottom right corner. (F) Quantification of S. mutans biomass from the microscopy data shown in E. n = 4. Quantification was completed using Gen5 Image+ software. Data graphing and two-way analysis of variance with multiple comparisons were completed in GraphPad Prism software.
Fig 7
Fig 7
Transcriptomes of S. mutans and S. mitis during coculture growth. (A) Principal component analysis (PCA) from RNA-Seq expression data (n = 3) of S. mitis grown in monoculture (black circles) or coculture with S. mutans (red hexagons). The proportion of variance for either PC1 (x-axis) or PC2 (y-axis) are listed. (B) Volcano plot of changes within individual S. mitis genes (circles) between monoculture and coculture with S. mutans. DEGs (= genes with ≥4 Log10 P-value and Log2 fold change ≥ (−)1) are shown in either red (upregulated, right) or blue (downregulated, left). Individual gene identifier, name, and/or characterized function are displayed, if able. (C) Stacked bar chart of upregulated S. mitis DEGs from the data set grouped by pathway/operon/function. (D) Stacked bar chart of downregulated S. mitis DEGs. (E) PCA from RNA-Seq expression data of S. mutans grown in monoculture (black circles) or coculture with S. mitis (red hexagons) (n = 3). (F) Volcano plot of changes within individual S. mutans genes between monoculture and coculture with S. mitis. (G) Stacked bar chart of upregulated S. mutans DEGs from the data set grouped by pathway/operon/function. (H) Stacked bar chart of downregulated S. mutans DEGs. (I) Venn diagram of the number of upregulated S. mutans DEGs from growth in quadculture (included S. gordonii, S. oralis, and S. sanguinis; gray) or coculture with S. mitis (red). (J) Venn diagram of the number of downregulated S. mutans DEGs. Data graphing and PCA calculations were completed in GraphPad Prism software.

Update of

References

    1. Peres MA, Macpherson LMD, Weyant RJ, Daly B, Venturelli R, Mathur MR, Listl S, Celeste RK, Guarnizo-Herreño CC, Kearns C, Benzian H, Allison P, Watt RG. 2019. Oral diseases: a global public health challenge. Lancet 394:249–260. doi:10.1016/S0140-6736(19)31146-8 - DOI - PubMed
    1. Bowen WH, Burne RA, Wu H, Koo H. 2018. Oral biofilms: pathogens, matrix, and polymicrobial interactions in microenvironments. Trends Microbiol 26:229–242. doi:10.1016/j.tim.2017.09.008 - DOI - PMC - PubMed
    1. Lemos JA. 2019. The biology of Streptococcus mutans. Microbiol Spectr 7:435–448. doi:10.1128/microbiolspec.gpp3-0051-2018 - DOI - PMC - PubMed
    1. Ahmady K, Marsh PD, Newman HN, Bulman JS. 1993. Distribution of Streptococcus mutans and Streptococcus sobrinus at sub-sites in human approximal dental plaque. Caries Res 27:135–139. doi:10.1159/000261531 - DOI - PubMed
    1. Pitts NB, Zero DT, Marsh PD, Ekstrand K, Weintraub JA, Ramos-Gomez F, Tagami J, Twetman S, Tsakos G, Ismail A. 2017. Dental caries. Nat Rev Dis Primers 3:17030. doi:10.1038/nrdp.2017.30 - DOI - PubMed

MeSH terms

LinkOut - more resources