. 2025 Feb 25;10(7):e187025.
doi: 10.1172/jci.insight.187025.

Atypical memory B cells acquire Breg phenotypes in hepatocellular carcinoma

Affiliations

Atypical memory B cells acquire Breg phenotypes in hepatocellular carcinoma

Shi Yong Neo et al. JCI Insight. .

Abstract

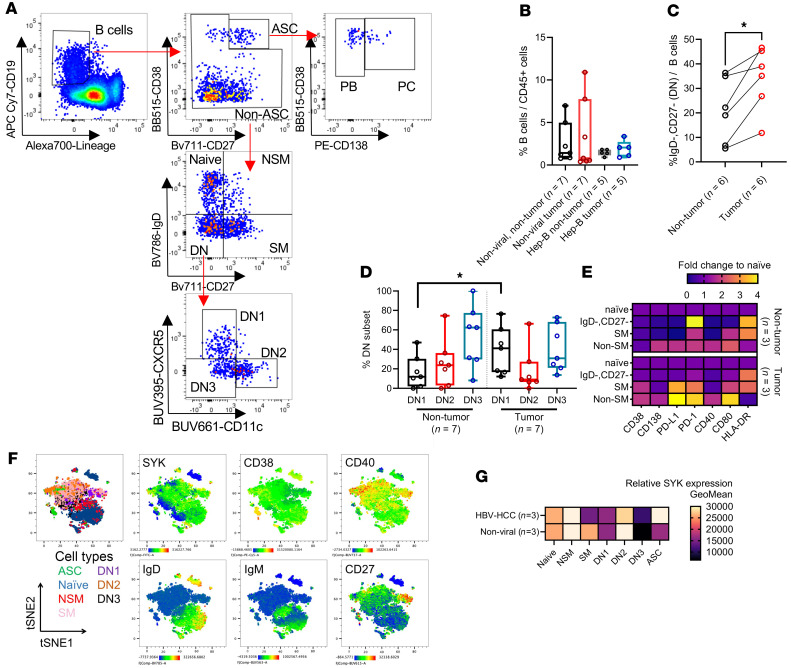
The functional plasticity of tumor-infiltrating lymphocyte B-cells (TIL-B) spans from antitumor responses to noncanonical immune suppression. Yet, how the tumor microenvironment (TME) influences TIL-B development is still underappreciated. Our current study integrated single-cell transcriptomics and B cell receptor (BCR) sequencing to profile TIL-B phenotypes and clonalities in hepatocellular carcinoma (HCC). Using trajectory and gene regulatory network analysis, we were able to characterize plasma cells and memory and naive B cells within the HCC TME and further revealed a downregulation of BCR signaling genes in plasma cells and a subset of inflammatory TNF+ memory B cells. Within the TME, a nonswitched memory B cell subset acquired an age-associated B cell phenotype (TBET+CD11c+) and expressed higher levels of PD-L1, CD25, and granzyme B. We further demonstrated that the presence of HCC tumor cells could confer suppressive functions on peripheral blood B cells that in turn, dampen T cell costimulation. To the best of our knowledge, these findings represent novel mechanisms of noncanonical immune suppression in HCC. While previous studies identified atypical memory B cells in chronic hepatitis and across several solid cancer types, we further highlighted their potential role as regulatory B cells (Bregs) within both the TME and peripheral blood of HCC patients.

Keywords: Adaptive immunity; Hepatology; Immunology.


Conflict of interest statement

Conflict of interest: The authors have declared that no conflict of interest exists.

Figures

Figure 1
Figure 1. Examination of B cell phenotypes in HCC through integration of single-cell transcriptomics and BCR profiling.
(A) tSNE projection of B cell subsets (clusters 1, 2, 4, and 5) and plasma cells (cluster 3) based on Louvain clustering and pie charts showing their distributions within nontumor and tumor sample types of different viral status. (B) tSNE projections of B cell subsets and plasma cells with their differentially expressed gene (DEG) features. Bubble heatmaps with unsupervised hierarchical clustering showing normalized expression of BCR-related genes (Biocarta, M9494) expressed by (C) B cells and (D) plasma cells isolated from various types of HCC resected tissues. (E) Chord diagram showing shared B cell clonotypes among the 5 clusters. (F) Alluvial plot illustrating the distribution of BCR clonotypes with respect to tumor and viral status, as well as denoting clusters identified from the gene expression data. In E and F, the proportions of BCR clonotypes within each B cell phenotype are represented by the width of the corresponding colored bands.
Figure 2
Figure 2. Trajectory and gene regulatory network analyses revealed differential transcriptional programs within B cell subsets found in HCC.
UMAP projections of monocle trajectory analysis showing the (A) Louvain clusters, (B) pseudotime analysis, (C) monocle states, and (D) relative expression score for BCR signaling pathway (Biocarta, M9494). (E) Hierarchical heatmap clustering of significant DEGs based on monocle state-of-trajectory analysis. (F) Chord diagram of common regulons between clusters based on the SCENIC method. Thickness of the connections between clusters depends on number of shared regulons between them. The top 5 relevant regulons with a regulon specificity score (RSS) cutoff of 0.35 were used for each Louvain cluster. (G) Gene enrichment was done based on top 200 differentially expressed genes with reference to mSigDB Hallmark gene sets. Only the top 10 significant gene sets are shown. Expression of normalized gene signature score in bulk primary tumors of the TCGA liver cancer cohort (LIHC) classified based on Ishak fibrosis score (H) and adjacent tissue inflammation scoring (I). Kruskal-Wallis test was used to determine significance. *P < 0.05; ****P < 0.0001. NS, not significant.
Figure 3
Figure 3. Patient-derived HCC organoids modulate B cell functionality in vitro.
(A) Representative immunofluorescence of patient-derived tumor and nontumor organoids stained for the expression of GPC3 (tumor marker) under ×10 objective magnification. Scale bars: 80 μm. (B) Percentage of B cells positive for p-SYK as measured by flow cytometry after 3 days of allogenic cocultures with patient-derived organoids (PDOs). Anti-IgM was used to restimulate B cells for 10 minutes after 3 days of PDO–B cell coculture. 24. In B, 2-way ANOVA with multiple comparison using Fisher’s LSD test was used to test for significance (n = 3 biological replicates). Concentration of (C) IgG and (D) IgM in supernatants collected from 3-day cocultures of PDOs and B cells. In C and D, Friedman’s test with multiple comparison was used (n = 6 biological replicates). (E) Frequencies of IL-10–producing B cells after overnight treatment with brefeldin A and monensin after 3 days of PDO coculture. (F) Relative mean fluorescence intensity (MFI) of TBET expression after 3 days of PDO coculture normalized to fold change of untreated B cells cultured alone. In CF, Friedman’s test with multiple comparison for Dunn’s test was used. In E and F, repeated-measures 1-way ANOVA with multiple comparisons was used to test for significance (n = 5 biological replicates). *P < 0.05; **P < 0.01; ****P < 0.0001.
Figure 4
Figure 4. Distinct atypical memory B cell and Breg phenotypes could be found within the HCC microenvironment.
(A) Flow cytometric dot plots for the gating strategy of various B and plasma cell subsets. ASC, antibody-secreting cells; PC, plasma cells; PB, plasmablasts; Non-SM, nonswitched memory; SM, switched memory; DN, double negative. (B) Percentage of CD19+ B cells within the immune compartment of various HCC tissues. (C) Frequencies of IgDCD27 DN cells versus total B cells comparing nontumor and tumor. (D) Proportions of DN1 (CXCR5+CD11c), DN2 (CXCR5CD11c+), and DN3 (CXCR5CD11c) within the DN B cell populations. In C and D, Wilcoxon’s signed-rank test was used to test for significance in the comparison of nontumor to tumor tissues. *P < 0.05. (E) Heatmap showing expression of various phenotypic markers in various B cell subsets normalized to naive B cells. (F) tSNE projections of various B cell subsets from flow cytometric phenotyping (n = 6 tumors). (G) Relative expression of SYK in various B cell subsets as measured by geometric mean of fluorescence intensity. Sample sizes reported in labels of all graphs and heatmaps.
Figure 5
Figure 5. HCC-associated Breg phenotypes are inducible upon exposure to tumor cells.
(A) Representative FACS plots for the expression of TBET and CD11c in various B cell subsets. (B) Frequencies of TBET+ and CD11c+ double-positive cells within various subsets of B cells. (C) Representative FACS plots for the expression of granzyme B (GzmB) and CD25 in various subsets of B cells. Frequencies of (D) CD25+ and (E) GzmB+ cells within various subsets of B cells. (F) Representative flow cytometry histograms (biological replicates, n < 4) for the expression of HLA-DR, GzmB, CD25, TBET, and PD-L1 after 3 days of coculturing B cells with the HCC tumor cell line HUH7 or SNU475 (also refer to Supplemental Figure 6, A–E). (G) Representative flow cytometry histograms (biological replicates, n = 5) for CFSE-labelled CD8+ T cells for calculation of proliferation index (also refer to Supplemental Figure 6F). (H) Proliferation of CD8+ T cells cotreated with either an IL-10–neutralizing antibody or anti–PD-L1 (atezolizumab) normalized to untreated control (see Methods for details of inhibitor treatment). Proliferation index was normalized to T cell–alone control. Kruskal-Wallis test was used to test for significance (B, D, E, and H). *P < 0.05; **P < 0.01. Sample sizes reported in labels of all graphs and heatmaps.
Figure 6
Figure 6. Expansion of DN2 and nonswitched memory B cells in peripheral blood of HCC patients.
(A) Percentage of total B cells versus CD45+ cells within peripheral blood of healthy donors compared to nonviral and viral HCC patients. HD, healthy donor. Frequencies of (B) nonswitched memory (NSM) B cells and (C) DN (CD27IgD) B cells versus total B cells within peripheral blood of healthy donors compared to nonviral and viral HCC patients. Frequencies of (D) DN1, (E) DN2, and (F) DN3 subsets within the DN B cell population in peripheral blood of healthy donors compared to nonviral and viral HCC patients. (G) Representative flow cytometry dot plot (left) and (H) percentage of PD-1+ cells within the DN2 B subset in the peripheral blood of healthy donors compared to nonviral and viral HCC patients (right). (I) Bubble dot plot for various functional markers expressed on B and plasma cell subsets within the peripheral blood of healthy donors and HCC patients. One-way ANOVA with multiple comparisons using Fisher’s LSD test was used to test for statistical significance within each B cell subset (also refer to Supplemental Figure 7, F–H). Kruskal-Wallis test was used for significance testing (AH). *P < 0.05; **P < 0.01; ***P < 0.001. NS, not significant. Sample sizes reported in labels of all graphs and heatmaps.

References

    1. Garnelo M, et al. Interaction between tumour-infiltrating B cells and T cells controls the progression of hepatocellular carcinoma. Gut. 2017;66(2):342–351. - PMC - PubMed
    1. Ruffin AT, et al. B cell signatures and tertiary lymphoid structures contribute to outcome in head and neck squamous cell carcinoma. Nat Commun. 2021;12(1):3349. doi: 10.1038/s41467-021-23355-x. - DOI - PMC - PubMed
    1. Gong L, et al. Comprehensive single-cell sequencing reveals the stromal dynamics and tumor-specific characteristics in the microenvironment of nasopharyngeal carcinoma. Nat Commun. 2021;12(1):1540. doi: 10.1038/s41467-021-21795-z. - DOI - PMC - PubMed
    1. Shao Y, et al. Regulatory B cells accelerate hepatocellular carcinoma progression via CD40/CD154 signaling pathway. Cancer Lett. 2014;355(2):264–272. doi: 10.1016/j.canlet.2014.09.026. - DOI - PubMed
    1. Xiao X, et al. PD-1hi identifies a novel regulatory B-cell population in human hepatoma that promotes disease progression. Cancer Discov. 2016;6(5):546–559. doi: 10.1158/2159-8290.CD-15-1408. - DOI - PubMed

MeSH terms

Substances

LinkOut - more resources