Identification of suitable qPCR reference genes for the normalization of gene expression in the BL10-mdx and D2-mdx mouse models of Duchenne muscular dystrophy
- PMID: 39999085
- PMCID: PMC11856590
- DOI: 10.1371/journal.pone.0318944
Identification of suitable qPCR reference genes for the normalization of gene expression in the BL10-mdx and D2-mdx mouse models of Duchenne muscular dystrophy
Abstract
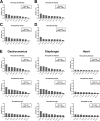
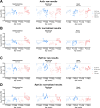
Duchenne muscular dystrophy (DMD) is an X-linked disorder that is caused by mutations in the DMD gene, leading to progressive muscle wasting and weakness. There is currently no cure for DMD. The BL10-mdx mouse is the most commonly used model in preclinical DMD studies, but it exhibits a mild disease phenotype compared to DMD patients, limiting research translatability. The newer D2-mdx mouse has a more severe phenotype at an early age and may better recapitulate human disease. To compare these mouse models on a transcriptional level with quantitative RT-PCR, stable and reliable reference genes are indispensable. We aimed to evaluate the stability and reliability of a panel of nine candidate reference genes (Actb, Ap3d1, Gapdh, Hmbs, Htatsf1, Pak1ip1, Rpl13a, Sdha and Zfp91) in the gastrocnemius, diaphragm and heart of mice from both strains and their corresponding wild types aged 4 to 52 weeks. Data was analyzed using geNorm, BestKeeper, deltaCt and NormFinder. We found that Htatsf1, Pak1ip1 and Zfp91 are suitable reference genes for normalization of gene expression in dystrophic and healthy mice, regardless of the tissue type or age. In our hands, Actb, Gapdh and Rpl13a were not suitable as reference genes, exhibiting tissue-, age-, or disease specific changes in expression. This study highlights the importance of the selection of suitable reference genes, as their stability can differ between specific experimental setups.
Copyright: © 2025 Putker et al. This is an open access article distributed under the terms of the Creative Commons Attribution License, which permits unrestricted use, distribution, and reproduction in any medium, provided the original author and source are credited.
Conflict of interest statement
I have read the journal's policy and the authors of this manuscript have the following competing interests: Annemieke Aartsma-Rus discloses being employed by LUMC which has patents on exon skipping technology, some of which has been licensed to BioMarin and subsequently sublicensed to Sarepta. As co-inventor of some of these patents AAR was entitled to a share of royalties. AAR further discloses being ad hoc consultant for PTC Therapeutics, Sarepta Therapeutics, Regenxbio, Dyne Therapeutics, Lilly, BioMarin Pharmaceuticals Inc., Eisai, Entrada, Takeda, Splicesense, Galapagos, Sapreme, Italfarmaco and Astra Zeneca. In the past 5 years ad hoc consulting has occurred for: Alpha Anomeric. AAR also reports being a member of the scientific advisory boards of Eisai, Hybridize Therapeutics, Silence Therapeutics, Sarepta therapeutics, Sapreme and Mitorx. SAB memberships in the past 5 years: ProQR. Remuneration for consulting and advising activities is paid to LUMC. In the past 5 years, LUMC also received speaker honoraria from PTC Therapeutics, Alnylam Netherlands, Italfarmaco and Pfizer and funding for contract research from Sapreme, Eisai, Galapagos, Synaffix and Alpha Anomeric. Project funding is received from Sarepta Therapeutics and Entrada via unrestricted grants. This does not alter our adherence to PLOS ONE policies on sharing data and materials.
Figures


Similar articles
-
Determination of qPCR reference genes suitable for normalizing gene expression in a novel model of Duchenne muscular dystrophy, the D2-mdx mouse.PLoS One. 2024 Nov 13;19(11):e0310714. doi: 10.1371/journal.pone.0310714. eCollection 2024. PLoS One. 2024. PMID: 39535998 Free PMC article.
-
Identification of qPCR reference genes suitable for normalizing gene expression in the mdx mouse model of Duchenne muscular dystrophy.PLoS One. 2019 Jan 30;14(1):e0211384. doi: 10.1371/journal.pone.0211384. eCollection 2019. PLoS One. 2019. PMID: 30699165 Free PMC article.
-
Determination of qPCR Reference Genes Suitable for Normalizing Gene Expression in a Canine Model of Duchenne Muscular Dystrophy.J Neuromuscul Dis. 2018;5(2):177-191. doi: 10.3233/JND-170267. J Neuromuscul Dis. 2018. PMID: 29614692
-
Humanization of the mdx Mouse Phenotype for Duchenne Muscular Dystrophy Modeling: A Metabolic Perspective.J Neuromuscul Dis. 2023;10(6):1003-1012. doi: 10.3233/JND-230126. J Neuromuscul Dis. 2023. PMID: 37574742 Free PMC article. Review.
-
Respiratory performance in Duchenne muscular dystrophy: Clinical manifestations and lessons from animal models.Exp Physiol. 2024 Sep;109(9):1426-1445. doi: 10.1113/EP091967. Epub 2024 Jul 18. Exp Physiol. 2024. PMID: 39023735 Free PMC article. Review.
Cited by
-
Photobiomodulation Therapy Reduces Oxidative Stress and Inflammation to Alleviate the Cardiotoxic Effects of Doxorubicin in Human Stem Cell-Derived Ventricular Cardiomyocytes.Biomedicines. 2025 Jul 21;13(7):1781. doi: 10.3390/biomedicines13071781. Biomedicines. 2025. PMID: 40722850 Free PMC article.
References
-
- Birnkrant DJ, Bushby K, Bann CM, Apkon SD, Blackwell A, Brumbaugh D, et al..; DMD Care Considerations Working Group. Diagnosis and management of Duchenne muscular dystrophy, part 1: diagnosis, and neuromuscular, rehabilitation, endocrine, and gastrointestinal and nutritional management. Lancet Neurol. 2018;17(3):251–67. doi: 10.1016/S1474-4422(18)30024-3 - DOI - PMC - PubMed
MeSH terms
LinkOut - more resources
Full Text Sources
Research Materials
Miscellaneous

