. 2025 Apr;12(15):e2413124.
doi: 10.1002/advs.202413124. Epub 2025 Feb 25.

Multiscale Dissection of Spatial Heterogeneity by Integrating Multi-Slice Spatial and Single-Cell Transcriptomics

Affiliations

Multiscale Dissection of Spatial Heterogeneity by Integrating Multi-Slice Spatial and Single-Cell Transcriptomics

Yuqi Chen et al. Adv Sci (Weinh). 2025 Apr.

Abstract

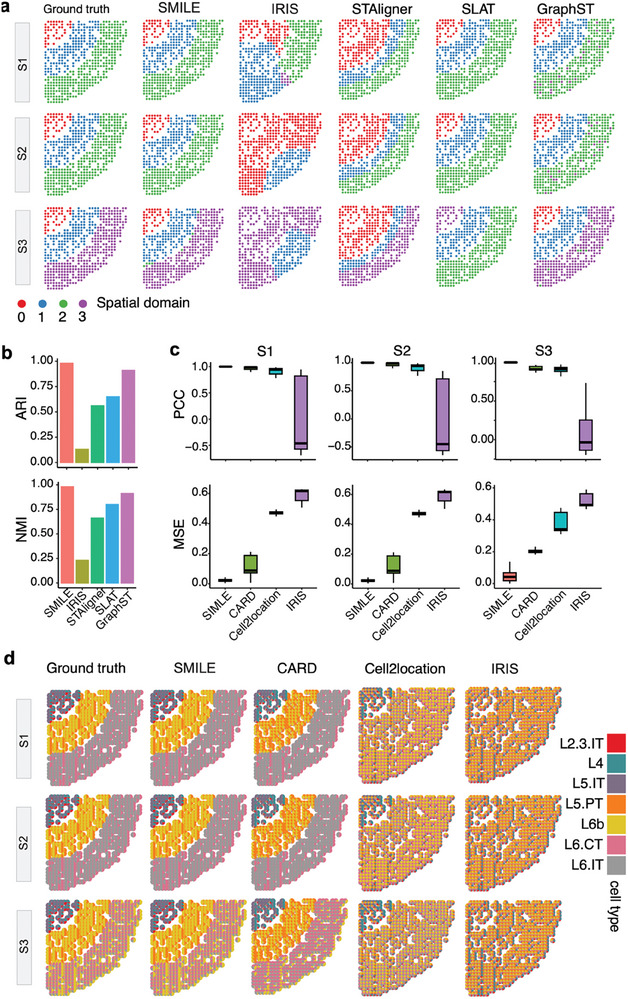
The spatial structure of cells is highly organized at multiscale levels from global spatial domains to local cell type heterogeneity. Existing methods for analyzing spatially resolved transcriptomics (SRT) are separately designed for either domain alignment across multiple slices or deconvoluting cell type compositions within a single slice. To this end, a novel deep learning method, SMILE, is proposed which combines graph contrastive autoencoder and multilayer perceptron with local constraints to learn multiscale and informative spot representations. By comparing SMILE with the state-of-the-art methods on simulation and real datasets, the superior performance of SMILE is demonstrated on spatial alignment, domain identification, and cell type deconvolution. The results show SMILE's capability not only in simultaneously dissecting spatial variations at different scales but also in unraveling altered cellular microenvironments in diseased conditions. Moreover, SMILE can utilize prior domain annotation information of one slice to further enhance the performance.

Keywords: cell type deconvolution; multiscale structure; scRNA‐seq; spatial domain; spatial transcriptomics.


Conflict of interest statement

The authors declare no conflict of interest.

Figures

Figure 1
Figure 1
Workflow of SMILE. The input data for SMILE are the gene expression profiles of spots, spot coordinates and scRNA‐seq reference data. The core algorithm of SMILE includes two key modules, one is for SRT data modeling indicated by blue lines and the other is for scRNA‐seq data modeling marked by green lines. Dashed green lines represent parameter sharing strategy. For each SRT data, the graph Gi is built based on spot coordinates, the corrupted graph Gi is constructed by randomly permuting nodes’ features, and the low‐dimensional embedding Zi of each graph is obtained by using a two‐layer GCN module. Cst is a multi‐layer perceptron classifier for SRT data if the domain label is available. D is a bilinear discriminator and Csc is a multi‐layer perceptron classifier for cell type representations of spots. Pt is the cell type representation of one slice, providing the cell type proportions of each spot in this slice. MNN indicates anchor pairs of different slices identified by mutual nearest neighbors based on spot embeddings or cell type representations. The outputs of SMILE are denoised SRT data, aligned embeddings of different slices, identified spatial domains and estimated cell type compositions of each spot.
Figure 2
Figure 2
Comparison of SMILE against existing methods on simulation data. a) Spatial visualization of the domains of the ground truth and those identified by SMILE, IRIS, STAligner, SLAT, and GraphST. b) Evaluation of domain identification accuracy using ARI and NMI metrics. c) Comparison of deconvolution performance among different methods using two metrics PCC and MSE. d) Proportions of deconvolved cell types from ground truth, SMILE, CARD, Cell2location, and IRIS, respectively. Each spot is represented by a pie chart of cell‐type proportions.
Figure 3
Figure 3
Evaluating performance of SMILE_semi and SMILE against existing methods on DLPFC datasets. a) The ground truth and spatial domains identified by seven methods on the slices of two DLPFC samples (151674 and 151675) from the same donors are shown. The manual annotations of cortical layers and white matter from the previous study are considered as ground truth. b) Barplots showing the accuracy of the identified spatial domains in terms of NMI and ARI scores. c) Mapping the deconvoluted cell type proportions from five methods onto tissues. The spatial scatter pie plot displays cell type proportions within spots. d) Boxplots showing Pearson correlation coefficients between the cell type proportions and the expression of marker genes for each major cell type.
Figure 4
Figure 4
SMILE unravels the spatially informed cellular heterogeneity of human dorsolateral prefrontal cortex layers. a) and b) Heatmap plots displaying the estimated mean cell type proportions by SMILE_semi and SMILE in each layer, respectively. c) A spatial scatter plot displaying the spatial distribution of the cell type proportions of indicated cell types across spatial locations, as inferred by SMILE_semi, SMILE, IRIS, CARD, and Cell2location, respectively. d) Spatial feature plots showing the expression of representative marker genes including CUX2, NEUROD6, RORB, PCP4, and NPTX1, respectively. The denoised (upper panel) and original (lower panel) gene expressions of these marker genes are shown for comparison.
Figure 5
Figure 5
SMILE identifies spatially patterned domains and cell states across adjacent slices of mouse brain. a) Joint analysis of two consecutive tissue sections from the mouse anterior and posterior brain by SMILE, IRIS, SLAT, STAligner, GraphST and Scanpy, respectively. Allen Brain Institute reference atlas diagram of the mouse cortex and the subdomain manual annotation (right). b) Results of mapping spatial data to single‐cell data. The spatial scatter pie plot displays the well‐structured cluster composition. c) Heatmap plot displaying the estimated mean cell type proportion for each cell type in each spatial domain detected by SMILE for the anterior and posterior slice, respectively. The color scale was normalized to the 0–1 range. d) A spatial scatter plot displaying the spatial distribution of the SMILE estimated cell type proportion for L2/3 IT, L4, L5 IT, and L6 CT across spatial locations. The bottom shows the denoised spatial expression of marker gene Lamp5, Calb1, Rorb, and Cplx3, respectively.
Figure 6
Figure 6
SMILE reveals differential cellular compositions and microenvironment signaling between healthy and psoriatic skin. a) UMAP visualization of the integrated embedding data from SMILE. Each point represents one spot. Spots are colored by biological conditions (left) and by identified spatial domains. b) UMAP visualization of the data and each point is represented by a pie chart showing the cell type compositions. c) Bar plot of the average ratios of each cell type in the domains C1, C2, C6, and C7. d) Bar plot showing the proportions of spots coming from NS or PP for each spatial domain. e) H&E staining of the NS and PP biopsies used for spatial sequencing (left), and spatial plot of spots colored by spatial domains (middle) and cell type compositions (right). f) Visualization of spatial distribution of the keratinocyte and myeloid cells detected by SMILE for NS and PP (top). The bottom shows the spatial plots showing the denoised expression levels of KRT1 and LYZ in NS and PP samples. g) Visualization of the co‐occurrence scores of domain 2 for PP (top) and NS (bottom) at increasing distance thresholds across the tissue. h) The differential outgoing and incoming interaction strength for keratinocytes. Signaling with positive values indicates increased interaction strength in PP compared to NS. i) Dot plot of probabilities mediated by L‐R pairs between keratinocytes and myeloid cells.
Figure 7
Figure 7
SMILE identifies spatial domains with cell type compositions on MOB data coming from Stereo‐seq and Slide‐seqV2 platforms. a) Spatial visualization of spatial domains identified in the integrated space of SMILE, IRIS, STAligner, SLAT, GraphST, and Scanpy, respectively. b) Spatial domains identified by SMILE and the corresponding marker genes in the slices of Stereo‐seq (top) and Slide‐seqV2 (bottom). c) Heatmap plot displaying the estimated mean cell type proportions for each cell type in each spatial domain detected by SMILE for Stereo‐seq (top) and Slide‐seqV2 (bottom), respectively.

References

    1. Ståhl P. L., Salmén F., Vickovic S., Lundmark A., Navarro J. F., Magnusson J., Giacomello S., Asp M., Westholm J. O., Huss M., Mollbrink A., Linnarsson S., Codeluppi S., Borg Å., Pontén F., Costea P. I., Sahlén P., Mulder J., Bergmann O., Lundeberg J., Frisén J., Science 2016, 353, 78. - PubMed
    1. Rodriques S. G., Stickels R. R., Goeva A., Martin C. A., Murray E., Vanderburg C. R., Welch J., Chen L. M., Chen F., Macosko E. Z., Science 2019, 363, 1463. - PMC - PubMed
    1. Vickovic S., Eraslan G., Salmén F., Klughammer J., Stenbeck L., Schapiro D., Äijö T., Bonneau R., Bergenstråhle L., Navarro J. F., Gould J., Griffin G. K., Borg Å., Ronaghi M., Frisén J., Lundeberg J., Regev A., Ståhl P. L., Nat. Methods 2019, 16, 987. - PMC - PubMed
    1. Chen A., Liao S., Cheng M., Ma K., Wu L., Lai Y., Qiu X., Yang J., Xu J., Hao S., Wang X., Lu H., Chen X. i., Liu X., Huang X., Li Z., Hong Y., Jiang Y., Peng J., Liu S., Shen M., Liu C., Li Q., Yuan Y., Wei X., Zheng H., Feng W., Wang Z., Liu Y., Wang Z., et al., Cell 2022, 185, 1777. - PubMed
    1. Danishuddin S. K., Kim J. J., Drug Discov. Today 2024, 29, 103889. - PubMed

LinkOut - more resources