Randomized Controlled Trial
. 2025 Mar 18;6(3):101978.
doi: 10.1016/j.xcrm.2025.101978. Epub 2025 Feb 24.

Near-infrared fluorescence imaging with an MET-targeting probe for biopsy site selection in patients with oral potentially malignant disorders

Affiliations
Randomized Controlled Trial

Near-infrared fluorescence imaging with an MET-targeting probe for biopsy site selection in patients with oral potentially malignant disorders

Jingbo Wang et al. Cell Rep Med. .

Abstract

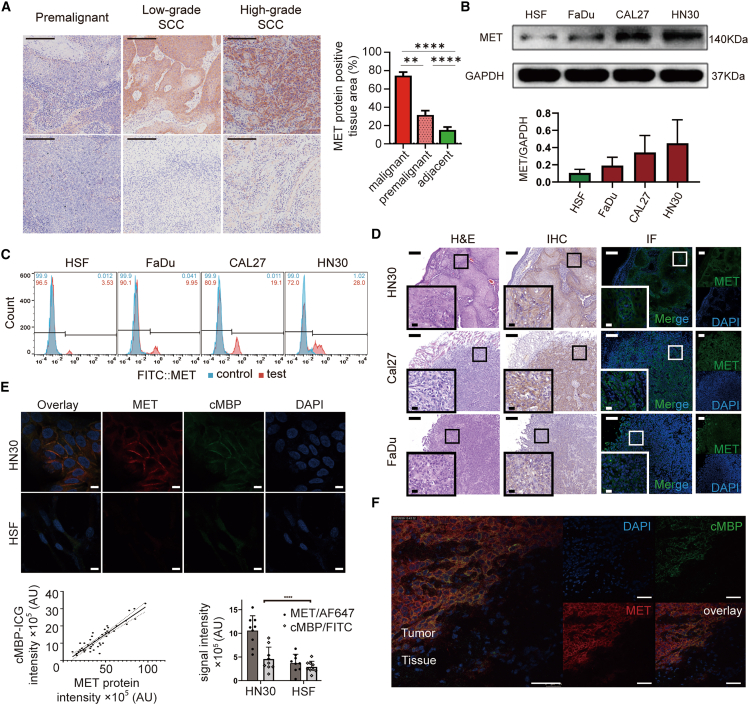
Accurate detection of malignant transformation in oral potentially malignant disorders (OPMDs) is crucial for guiding effective treatment and improving patient management. This study evaluates the potential of MET-binding peptide-indocyanine green (cMBP-ICG), a mesenchymal-epithelial transition factor (MET)-targeted near-infrared fluorescence imaging (NIRFI) probe, for biopsy site selection in OPMDs. Preclinical results demonstrate the superior accuracy of NIRFI-assisted biopsy over conventional oral examination (COE)-based biopsy in detecting high-grade dysplasia (HGD) or squamous cell carcinoma (SCC) and reducing missed detection rates. In a clinical trial with 50 patients, NIRFI-assisted biopsy achieves significantly higher diagnostic accuracy compared to COE-based biopsy (91% vs. 72%, p = 0.0005). These findings underscore the importance of NIRFI in enhancing diagnostic precision, supporting early detection and enabling timely and accurate treatment interventions for patients with OPMDs. The clinical trial is registered under the registration number ChiCTR2300074454.

Keywords: 4-NQO-induced OSCC model; biopsy site selection; fluorescence-guided biopsy; mesenchymal-epithelial transition factor; molecular imaging; near-infrared targeted fluorescent imaging; oral potentially malignant disorders; oral squamous cell carcinoma; topical application.


Conflict of interest statement

Declaration of interests The authors have a related patent “Near-infrared fluorescence imaging agent targeting c-Met and its use” filed by X.T. et al., Shanghai Ninth People’s Hospital, China, 2022 (patent number 202210118240.6).

Figures

None
Graphical abstract
Figure 1
Figure 1
Verification of elevated MET expression in patient samples and orthotopic tumor tissues (A) Immunohistochemical detection of MET using an anti-MET antibody in various grades of OSCC (top row) and adjacent normal epithelial tissues (bottom row). Brown: MET-positive tissue. Blue: hematoxylin counterstain. Bar graph, mean (SD) proportion of tissue area positive for MET expression was 74.50% (9.8%) in malignant tissues, 31.67% (14.8%) in premalignant tissues, and 15.11% (9.6%) in adjacent normal epithelial tissues. Malignant vs. premalignant, p < 0.0001; malignant vs. adjacent, p < 0.0001; premalignant vs. adjacent, p = 0.0027. Scale bars, 250 μm. n (specimens) = 9 biological replicates. Data are represented as mean ± SEM, with error bars shown only above the mean, analyzed using unpaired Student’s t test. ∗∗p < 0.01, ∗∗∗∗p < 0.0001. (B and C) (B) Western blot analysis of MET protein levels in cell lines FaDu, CAL27, and HN30 and control keratin epithelial cell line HSF (top). Bar graph quantification of MET expression (bottom). (C) Quantitative measurement of expression levels of FITC-conjugated MET in OSCC cell lines and control keratin epithelial cell line by flow cytometry. Data are represented as mean ± SEM, with error bars shown only above the mean. (B and C) n (HSF, CAL27, HN30, and FaDu) = 3 biological replicates. (D) H&E staining (left), immunohistochemical detection (middle), and immunofluorescence (right) of MET expression in oral SCC orthotopic tumor tissues. Blue: DAPI-stained nuclei. Green: AF647-conjugated MET. The long horizontal scale bars correspond to 200 μm, while the short horizontal scale bars represent 20 μm. n (ex vivo sections) = 9 biological replicates. (E) Localization of cMBP/FITC in HN30 and HSF cells via confocal imaging. Blue: DAPI-stained nuclei. Green: FITC-labeled cMBP. Red: AF647-conjugated anti-MET. Scale bars, 10 μm. Correlation in HN30 cells was evaluated with Pearson R-squared test. Pixel intensity of nine regions of interest from three cell slide pairs analyzed with ImageJ. n (cell slides) = 3 biological replicates. Data are represented as mean ± SEM, with error bars shown only above the mean, analyzed using unpaired Student’s t test. ∗∗∗∗p < 0.0001. (F) After intravenous injection of cMBP-ICG into OSCC nude mouse model, tumor tissues were harvested, frozen sections were prepared, and the distribution of MET in the frozen sections was assessed via immunofluorescence staining. Blue: DAPI-stained nuclei. Green: cMBP-ICG. Red: AF647-conjugated anti-MET. Scale bars, 50 μm. n (negative control group, cMBP-ICG injection group, and ICG injection group) = 3 biological replicates.
Figure 2
Figure 2
Lesion development and MET expression in the 4-NQO-induced OSCC mouse model (A and B) (A) Overview of the experiments. Three mice from each group were killed at 0, 12, 16, 20, and 24 weeks. Tissue samples from the tongues of sacrificed mice were collected and subjected to histopathological examination after magnetic resonance imaging. (B) Typical presentations of tongue lesions in mouse model at different times after 4-NQO initiation. NOR, normal controls; W, weeks. (A and B) n (control) = 15, n (4-NQO-treated mice) = 15 biological replicates. (C) Number of lesions of different pathological types at various times after 4-NQO initiation. Data are represented as mean ± SEM, analyzed using unpaired Student’s t test. ∗∗∗p < 0.001, ∗∗∗∗p < 0.0001. (D) Distribution of lesions of different pathological types at different times after 4-NQO initiation. W, weeks. (E) H&E staining (top) and immunohistochemistry staining (bottom) of lesions of different pathological types. NOR, normal controls. Scale bars, 300 μm. (F) Percentage of lesion area positive for MET for lesions of different pathological types. Data are represented as mean ± SEM, analyzed using unpaired Student’s t test. ∗∗∗∗p < 0.0001. (G) Percentage of lesion area positive for MET, lesion diameter, and distribution of lesions of different pathological types at different times after initiation of 4-NQO. (H) Receiver operating characteristic (ROC) curves evaluating the performance of MET-positive area as a classifier. (C–H) n (lesions) = 121 biological replicates.
Figure 3
Figure 3
Design of the clinical trial Patients with OPMDs underwent visual inspection and NIRFI examination of the oral cavity prior to biopsy. First, an oral mucosal specialist independently selected the most appropriate biopsy site (BSC) based on visual inspection without reference to NIRFI, documented the biopsy site with photos, and assigned a clinical diagnosis. Next, an NIRFI operator selected the most appropriate biopsy site with NIRFI assistance (BSN), captured key frames, and marked the site directly on the images, which were then documented along with the clinical diagnosis. Subsequently, patients in the NIRFI-assisted biopsy group underwent biopsy at BSN, while subjects in the COE-based biopsy group underwent biopsy at BSC. Six months after biopsy, all patients were re-examined visually to check for new lesions, and any newly identified lesions were biopsied using the biopsy method used previously. All biopsy tissues were paraffin embedded and H&E stained and categorized as negative (normal epithelium, LGD) or positive (HGD, SCC). BSNN, NIRFI-assisted biopsy sites in the NIRFI-assisted biopsy group; BSCN, specialist-selected biopsy sites without NIRFI in the NIRFI-assisted biopsy group; BSCC, specialist-selected biopsy sites without NIRFI in the COE group; BSNC, NIRFI-assisted biopsy sites in the COE-based biopsy group; FN, false negative; FP, false positive; TN, true negative; TP, true positive. Subscript NIRFI indicates the NIRFI-assisted biopsy group, and subscript COE indicates the COE-based biopsy group.
Figure 4
Figure 4
Clinical cMBP-ICG fluorescence imaging of OPMDs (A) Representative bright-field images (top), black and white NIRFI images (middle), and combined pseudo-color fluorescence and bright-field images (bottom) of biopsy sites. The left two panels depict typical imaging findings for pathologically negative cases (ulcer and lichen planus), while the right two panels depict typical imaging findings for pathologically positive cases (HGD and SCC). Before the wash step, fluorescence signals were similar in all four panels due to physical attachment of cMBP-ICG. After the wash step, non-targeted cMBP-ICG is removed, and fluorescence signals are higher in pathologically positive cases than in pathologically negative cases. (B) Pre-wash, after-wash, and baseline palate MFI and TBR for all cases, arranged in descending order of after-wash MFI (top row) and TBR (bottom row). No asterisk: pathologically negative. One asterisk: HGD. Two asterisks: SCC. (C) Representative bright-field images (top), black and white NIRFI images (middle), and combined pseudo-color fluorescence and bright-field images (bottom) from cases with differing biopsy sites as determined by NIRFI and COE. Arrows: NIRFI-assisted biopsy sites. Stars: COE-based biopsy sites. (D) Comparison of MFI and TBR between the pathologically negative (green) and pathologically positive (red) groups. (E) ROC curves for NIRFI-assisted biopsy and COE-based biopsy in distinguishing pathologically negative and pathologically positive OPMDs. Data are represented as mean ± SEM, with error bars shown only above the mean, analyzed using unpaired Student’s t test. ∗p < 0.05, ∗∗p < 0.01, ∗∗∗p < 0.001; ns, not significant. (F) Multivariable ROC curve analysis for different methods of distinguishing pathologically negative and pathologically positive OPMDs. (A–F) n (participants) = 50 biological replicates. n (selected biopsy sites) = 100 technical replicates.

References

    1. Warnakulasuriya S., Kujan O., Aguirre-Urizar J.M., Bagan J.V., González-Moles M.Á., Kerr A.R., Lodi G., Mello F.W., Monteiro L., Ogden G.R., et al. Oral potentially malignant disorders: A consensus report from an international seminar on nomenclature and classification, convened by the WHO Collaborating Centre for Oral Cancer. Oral Dis. 2021;27:1862–1880. doi: 10.1111/odi.13704. - DOI - PubMed
    1. Seoane J., Alvarez-Novoa P., Gomez I., Takkouche B., Diz P., Warnakulasiruya S., Seoane-Romero J.M., Varela-Centelles P. Early oral cancer diagnosis: The Aarhus statement perspective. A systematic review and meta-analysis. Head Neck. 2016;38:E2182–E2189. doi: 10.1002/hed.24050. - DOI - PubMed
    1. Nieminen M., Aro K., Mäkitie A., Harlin V., Kainulainen S., Jouhi L., Atula T. Challenges in diagnosing head and neck cancer in primary health care. Ann. Med. 2021;53:26–33. doi: 10.1080/07853890.2020.1802060. - DOI - PMC - PubMed
    1. Walsh T., Macey R., Kerr A.R., Lingen M.W., Ogden G.R., Warnakulasuriya S. Diagnostic tests for oral cancer and potentially malignant disorders in patients presenting with clinically evident lesions. Cochrane Database Syst. Rev. 2021;7 doi: 10.1002/14651858.CD010276.pub3. - DOI - PMC - PubMed
    1. Zhang Z., Du Y., Shi X., Wang K., Qu Q., Liang Q., Ma X., He K., Chi C., Tang J., et al. NIR-II light in clinical oncology: opportunities and challenges. Nat. Rev. Clin. Oncol. 2024;21:449–467. doi: 10.1038/s41571-024-00892-0. - DOI - PubMed

Publication types