. 2025 Feb 25;13(1):28.
doi: 10.1038/s41413-024-00381-1.

Bifidobacterium animalis subsp. lactis A6 ameliorates bone and muscle loss via modulating gut microbiota composition and enhancing butyrate production

Affiliations

Bifidobacterium animalis subsp. lactis A6 ameliorates bone and muscle loss via modulating gut microbiota composition and enhancing butyrate production

Ming Chen et al. Bone Res. .

Abstract

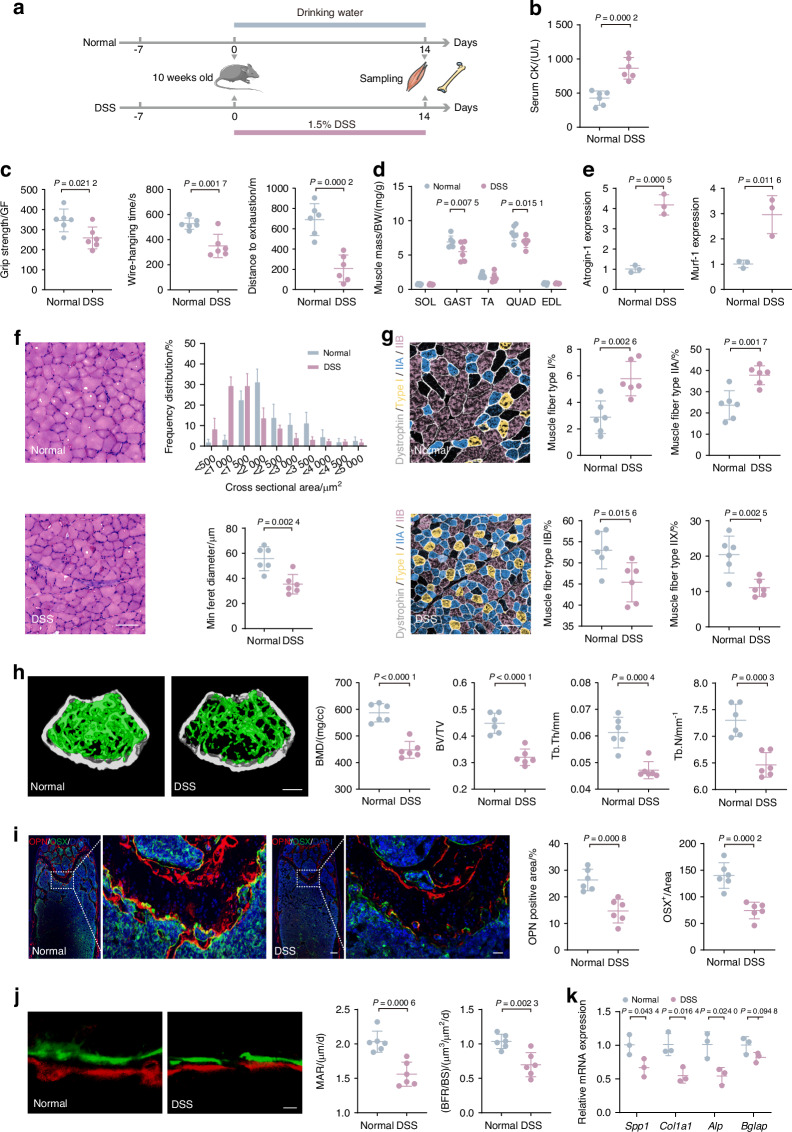
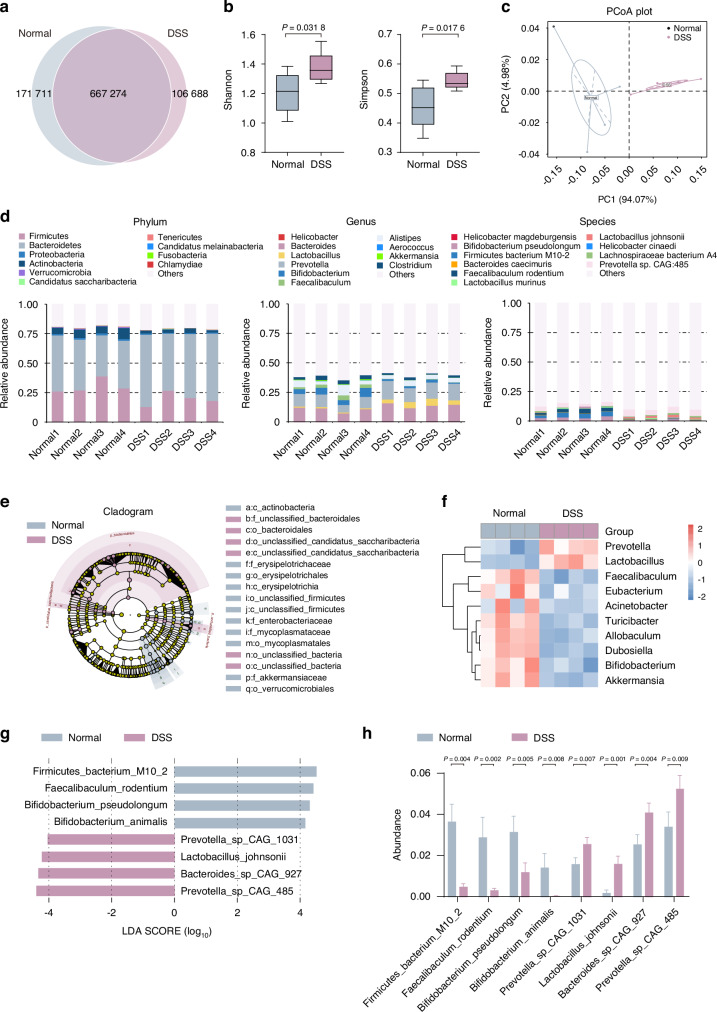
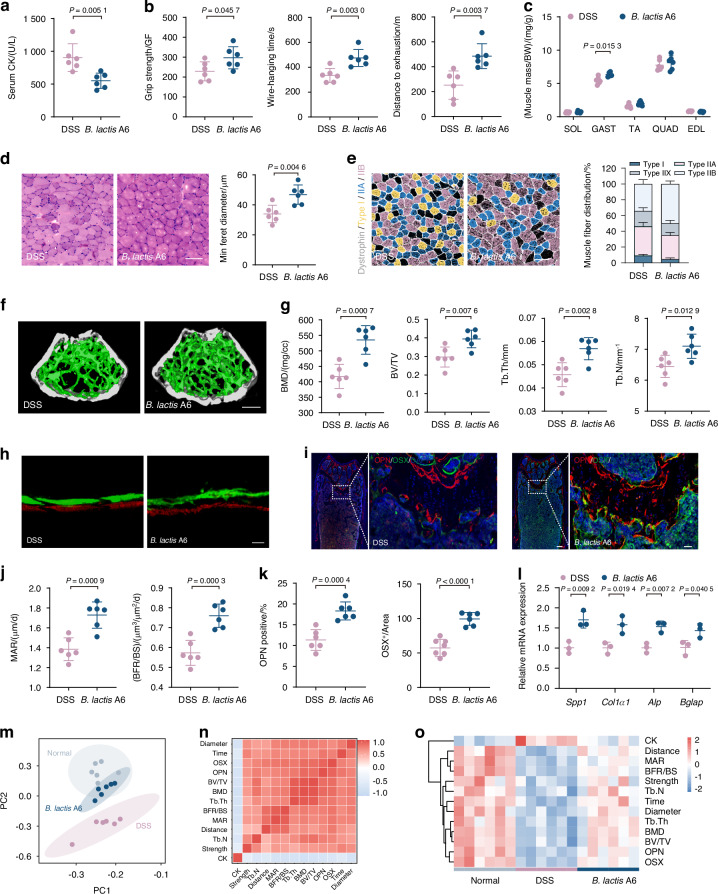
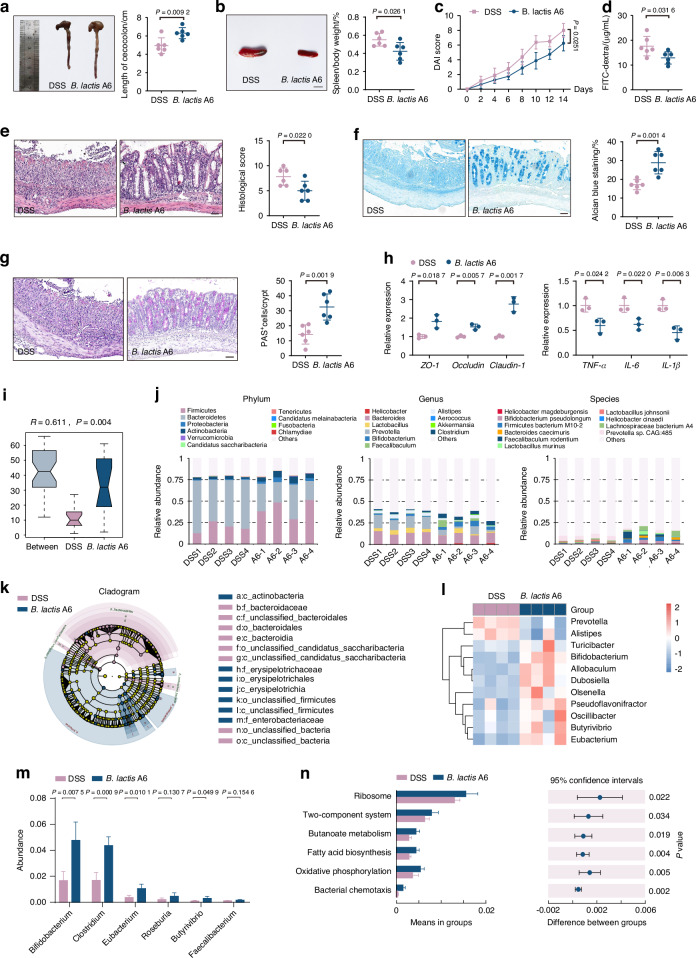
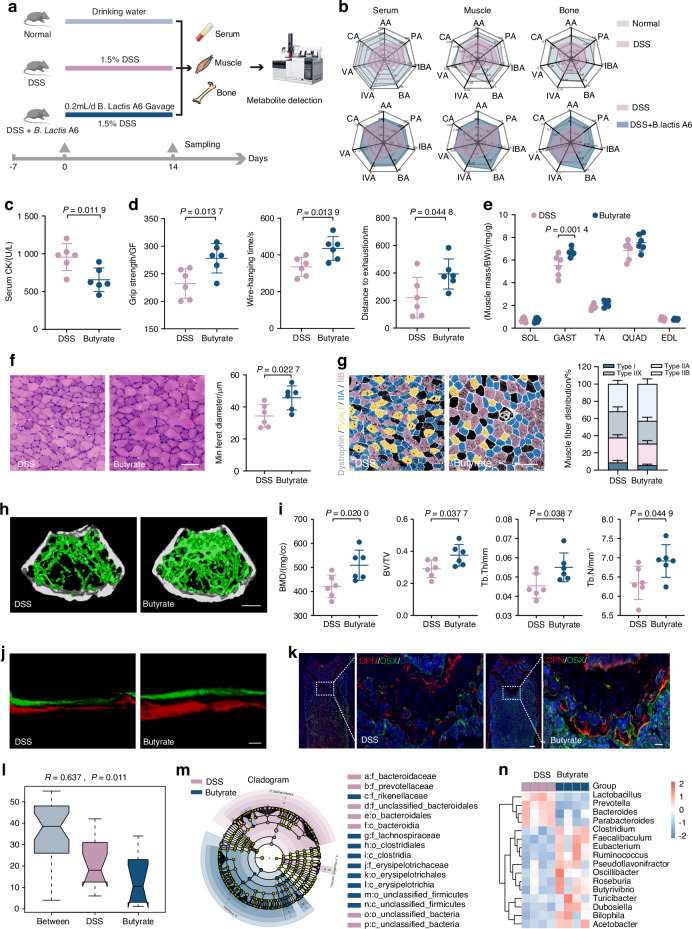
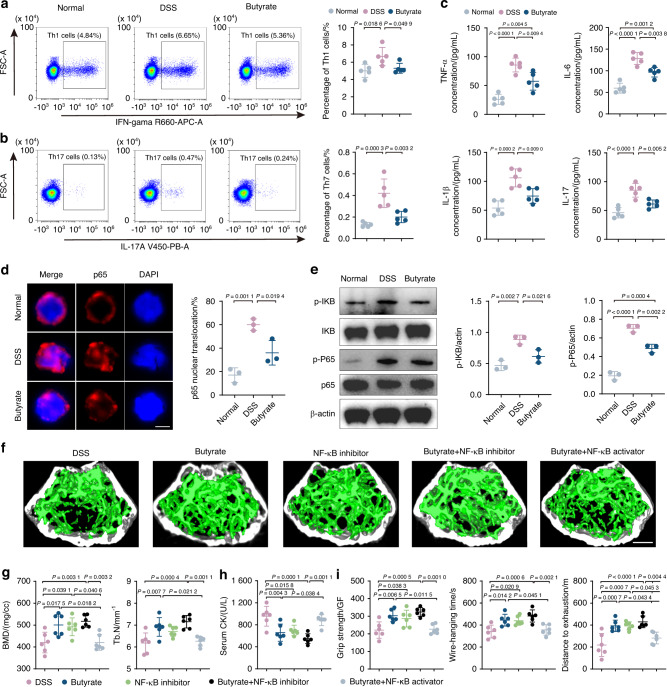
Systematic bone and muscle loss is a complex metabolic disease, which is frequently linked to gut dysfunction, yet its etiology and treatment remain elusive. While probiotics show promise in managing diseases through microbiome modulation, their therapeutic impact on gut dysfunction-induced bone and muscle loss remains to be elucidated. Employing dextran sulfate sodium (DSS)-induced gut dysfunction model and wide-spectrum antibiotics (ABX)-treated mice model, our study revealed that gut dysfunction instigates muscle and bone loss, accompanied by microbial imbalances. Importantly, Bifidobacterium animalis subsp. lactis A6 (B. lactis A6) administration significantly ameliorated muscle and bone loss by modulating gut microbiota composition and enhancing butyrate-producing bacteria. This intervention effectively restored depleted butyrate levels in serum, muscle, and bone tissues caused by gut dysfunction. Furthermore, butyrate supplementation mitigated musculoskeletal loss by repairing the damaged intestinal barrier and enriching beneficial butyrate-producing bacteria. Importantly, butyrate inhibited the NF-κB pathway activation, and reduced the secretion of corresponding inflammatory factors in T cells. Our study highlights the critical role of dysbiosis in gut dysfunction-induced musculoskeletal loss and underscores the therapeutic potential of B. lactis A6. These discoveries offer new microbiome directions for translational and clinical research, providing promising strategies for preventing and managing musculoskeletal diseases.


Conflict of interest statement

Competing interests: The authors declare no competing interests.

Figures

Fig. 1
Fig. 1
DSS-induced gut dysfunction leads to bone and muscle loss in mice. a Schematic representation illustrating the experimental design. Mice were exposed to dextran sodium sulfate (DSS) in DSS group and PBS in normal group for 2 weeks. b Measurement of CK activity of the serum (n = 6). c Assessment of physical performance using all-limb force, longest suspension time, and distance to exhaustion evaluated by handgrip, hanging wire tests, and treadmill, respectively (n = 6). d Muscle mass analysis from each group (n = 6). e mRNA expressions of Atrogin-1 and Murf-1 in gastrocnemius, tested by qPCR (n = 3). f Representative images of H&E staining in gastrocnemius cross-sections, with the frequency distribution of CSA and quantification of average minimal Feret’s diameter of myofibers (n = 6). Scale bar, 100 μm. g Representative immunofluorescence images to visualize specific types of muscle fibers and quantification. Type I (purple), type IIA (green), type IIX (not shown), and type IIB (red) (n = 6). Scale bar, 100 μm. h Representative micro-CT images of distal femoral metaphyseal trabecular bone. Quantitative analysis of bone mass, including BMD, BV/TV, Tb. Th, and Tb. N (n = 6). Scale bar, 500 μm. i Representative images of OSX (green) and OPN (red) immunostainings and quantification of OPN+ and OSX+ area on distal femurs (n = 6). Scale bar, 200 and 50 μm, respectively. j Representative images and quantification of new bone formation assessed by dynamic histomorphometric analyses (n = 6). Scale bar, 25 μm. k mRNA Expressions of osteogenesis gene (Spp1, Col1a1, Alp, and Bglap) expression in tibia, tested by qPCR (n = 3). Values are represented as the average ± standard deviation. The significance level (P value) was determined through a two-sided Welch’s t-test
Fig. 2
Fig. 2
Metagenomic analysis reveals altered gut microbiota composition following DSS exposure. a Venn diagram analysis of gene numbers detected in two groups. b The box plot illustrates α-diversity using the Shannon and Simpson indices. c Principal coordinate analysis (PCoA) of β-diversity at the phylum tier is conducted via a Bray–Curtis matrix comparison for both groups. d Structure plot of the relative fecal bacterial abundances in phylum and genus-level based on Bray–Curtis distance. Analysis of cladogram generated from LEfSe (e) and the heatmap cluster (f) across different taxa levels. g Analysis of LDA score in the species level. h Quantitative analysis of differential taxa in two groups. Values are represented as the average ± standard deviation. The significance level (P value) was determined through a two-sided Welch’s t-test
Fig. 3
Fig. 3
Administration of probiotic Bifidobacterium animalis subsp. lactis A6 (B. lactis A6) alleviates gut dysfunction-triggered bone and muscle loss. a Measurement of CK activity of the serum (n = 6). b Assessment of physical performance by handgrip, hanging wire tests, and treadmill, respectively (n = 6). c Muscle mass analysis from each group (n = 6). d Representative images of H&E staining in gastrocnemius cross-sections and quantification of average minimal Feret’s diameter of myofibers (n = 6). Scale bar, 100 μm. e Representative immunofluorescence images to visualize specific types of muscle fibers and fiber type compositions (n = 6). Scale bar, 100 μm. f Representative micro-CT images of distal femoral metaphyseal bone. g Quantitative analysis of bone mass (n = 6). Scale bar, 500 μm. h Representative images of new bone formation assessed by dynamic histomorphometric analyses (n = 6). Scale bar, 25 μm. i Representative images of OSX (green) and OPN (red) immunostainings of OPN+ and OSX+ area on distal femurs (n = 6). Scale bar, 200 and 50 μm, respectively. Quantitative analysis of MAR, BFR/BS (j) and immunofluorescence staining of OPN and OSX (k) in femur tissues. l mRNA expressions of osteogenesis gene (Spp1, Col1a1, Alp, and Bglap) expression in tibia, tested by qPCR (n = 3). m Principal component analysis among the normal, DSS exposure, and B. lactis treatment group. n Correlation analysis of muscle function parameters and bone formation parameters among three groups. o Heatmap of B. lactis A6’s therapeutic efficacies based on indexes of muscle and bone function. Values are presented as the average ± standard deviation. The significance level (P value) was determined through a two-sided Welch’s t-test (al) and assessed with one-way ANOVA (mo)
Fig. 4
Fig. 4
B. lactis A6 alleviates intestinal injury and enhances butyrate-producing bacteria composition. a Images and quantification of colon tissues (n = 6). b Images and quantification of spleen tissues (n = 6). Scale bar, 1 cm. c DAI score evaluation (n = 6). d FITC-dextran concentrations in serum (n = 6). Representative images and quantification analysis of hematoxylin and eosin (H&E) (e), Alcian Blue (AB) (f) and periodic acid Schiff (PAS) staining (g) from each group (n = 6). Scale bar, 50 μm. h mRNA expressions for tight junction proteins (Zonula Occcludens-1 (ZO-1), Occludin, and Claudin-1) (left) and inflammatory indicators (TNF-α, IL-6, and IL-1β) (right) in colon tissues, tested by qPCR (n = 3). i Anosim analysis based on phylum level between the two groups. j Structure plot of the relative fecal bacterial abundances in phylum and genus-level based on Bray–Curtis distance. k, l Analysis of cladogram generated from LEfSe and the heatmap cluster across different taxa levels. m Quantitative analysis of differential taxa in two groups. n Significant differences in metagenomic functions in B. lactis A6 groups compared with DSS controls based on KEGG database. Values are displayed as average ± standard deviation. Significance (P value) is calculated using two-way ANOVA multiple comparisons (c) or two-tailed Welch’s t-test (a, b, dh)
Fig. 5
Fig. 5
B. lactis A6-favored butyrate alleviates bone and muscle and enriches beneficial SCFA-producing bacteria. a Schematic representation illustrating the experimental design. Short-chain fatty acids (SCFAs) were detected in serum, muscle, and bone through GC–MS analysis. b Mean compositions of SCFAs in serum, muscle, and bone from the normal and DSS group (upper), and from the DSS and B. lactis A6 group (down) (n = 6). c Measurement of CK activity of the serum (n = 6). d Assessment of physical performance by handgrip, hanging wire tests, and treadmill, respectively (n = 6). e Muscle mass analysis from each group (n = 6). f H&E staining images in gastrocnemius cross-sections and quantification of average minimal Feret’s diameter of myofibers (n = 6). Scale bar, 100 μm. g Representative immunofluorescence images to visualize specific types of muscle fibers and fiber type compositions (n = 6). Scale bar, 100 μm. h Representative micro-CT images of metaphyseal bone. i Quantitative analysis of bone mass (n = 6). Scale bar, 500 μm. j Representative images and quantification of new bone formation assessed by dynamic histomorphometric analyses (n = 6). Scale bar, 25 μm. k Representative images of OSX (green) and OPN (red) immunostainings of OPN+ and OSX+ area on distal femurs (n = 6). Scale bar, 200 and 50 μm, respectively. l Anosim analysis based on phylum level between the DSS and butyrate group. m, n Analysis of cladogram generated from LEfSe and the heatmap cluster across different taxa levels. Values are represented as the average ± standard deviation. The significance level (P value) was determined through a two-sided Welch’s t-test
Fig. 6
Fig. 6
Butyrate reduces inflammation in T cells and inhibits NF-κB pathway activation. a, b Percentages of Th1 and Th17 cells detected by flow cytometry (n = 5). c Concentration of TNF-a, IL-6, IL-1β, and IL-17 in serum analyzed by ELISA (n = 5). d Immunofluorescence with NF-κB antibody in T cells from normal, DSS-exposed, and butyrate-treated mice. Immunopositive cells for nuclear NF-κB were quantified as percent of total cells (n = 3). Scale bar, 5 μm. e Representative WB images and quantitative analyses of p-P65, P65, p-IκB, and IκB (n = 3). Micro-CT images (f) and quantification of BMD, Tb. N (g) in DSS group, butyrate-treated group, NF-κB inhibitor group, butyrate + NF-κB inhibitor group and butyrate + NF-κB inhibitor group. Scale bar, 500 μm. Quantification of serum CK (h), grip strength, wire-hanging time, and distance to exhaustion (i) in different groups. Values are represented as the average ± standard deviation. The significance level (P value) was assessed with one-way ANOVA

References

    1. Hirschfeld, H. P., Kinsella, R. & Duque, G. Osteosarcopenia: where bone, muscle, and fat collide. Osteoporos. Int.28, 2781–2790 (2017). - PubMed
    1. Kirk, B., Zanker, J. & Duque, G. Osteosarcopenia: epidemiology, diagnosis, and treatment—facts and numbers. J. Cachexia Sarcopenia Muscle11, 609–618 (2020). - PMC - PubMed
    1. Skrzypczak, D. et al. A vicious cycle of osteosarcopeniain inflammatory bowel diseases-aetiology, clinical implications and therapeutic perspectives. Nutrients13, 293 (2021). - PMC - PubMed
    1. Syrbe, U. & Siegmund, B. Bone marrow Th17 TNFα cells induce osteoclast differentiation and link bone destruction to IBD. Gut64, 1011–1012 (2015). - PubMed
    1. Kaplan, G. G. & Windsor, J. W. The four epidemiological stages in the global evolution of inflammatory bowel disease. Nat. Rev. Gastroenterol. Hepatol.18, 56–66 (2021). - PMC - PubMed

LinkOut - more resources