. 2025 Feb 25;16(1):1968.
doi: 10.1038/s41467-025-56869-9.

Suppression of endothelial ceramide de novo biosynthesis by Nogo-B contributes to cardiometabolic diseases

Affiliations

Suppression of endothelial ceramide de novo biosynthesis by Nogo-B contributes to cardiometabolic diseases

Luisa Rubinelli et al. Nat Commun. .

Abstract

Accrual of ceramides, membrane and bioactive sphingolipids, has been implicated in endothelial dysfunction preceding cardiometabolic diseases. Yet, direct in vivo evidence, underlying mechanisms, and pathological implications are lacking. Here we show that suppression of ceramides and sphingosine-1-phosphate (S1P), a product of ceramide degradation, are causally linked to endothelial dysfunction and activation, contributing to vascular and metabolic disorders in high fat diet fed (HFD) male mice. Mechanistically, the upregulation of Nogo-B and ORMDL proteins suppress ceramide de novo biosynthesis in endothelial cells (EC) of HFD mice, resulting in vascular and metabolic dysfunctions. Systemic and endothelial specific deletion of Nogo-B restore sphingolipid signaling and functions, lowers hypertension, and hepatic glucose production in HFD. Our results demonstrate in vivo that ceramide and S1P suppression rather than accrual contributes to endothelial dysfunction and cardiometabolic diseases in HFD mice. Our study also sets a framework for the development of therapeutic strategies to treat these conditions.


Conflict of interest statement

Competing interests: The authors declare no competing interests.

Figures

Fig. 1
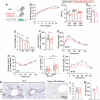
Fig. 1. Sphingolipid metabolism is suppressed in EC and resistance arteries of obese mice and correlated with pro-inflammatory phenotype.
A Schematic representation of the experimental design and of the sphingolipid pathway. Male WT mice were fed with SD or HFD for 6 months (Created in BioRender. Di Lorenzo, A. (2025)). B Body weight (WT SD n = 10 mice and WT HFD n = 9 mice). C Glucose tolerance test (GTT) (WT SD n = 15 mice, WT HFD n = 9 mice). D WB analysis of NOGO-B, ORMDLs, SPTLC1 and SPTLC2 in EC FACS-sorted from heart and lung and E, F relative quantification (WT SD n = 7 mice, WT HFD n = 8 mice). β-ACTIN was used as loading control. G Heatmap of genes for the SPT complex, inflammation, and lipid transport in FACS-sorted EC from heart and lung, *indicates that the difference is significant (WT SD n = 4 mice and WT HFD n = 4 mice). LC–MS/MS quantification of H total ceramides, I specific ceramides, C16:0-dihydroceramide (dhC16:0-Cer), dihydrosphingosine (dhSph), sphingosine (Sph), sphingosine-1-phosphate (S1P), and J total and K specific sphingomyelins (SM) in FACS-sorted EC from heart and lung (WT SD n = 16 mice, WT HFD n = 18 mice). L Immunofluorescence staining for NOGO-A/B and WGA of mesenteric arteries (MA) sections. Nogo-A/B deficient MA were used as negative control. Nuclei were stained with DAPI. LC–MS/MS quantification of M total and N specific Cer, and O total and P specific SM in MA (WT SD n = 9 mice and WT HFD n = 11 mice). Data are expressed as mean ± SEM *p ≤ 0.05, **p ≤ 0.01, ***p ≤ 0.001. Statistical significance was determined by unpaired t-test two-tailed (B, E, F, HK, MP) and two-way ANOVA with Sidak multiple comparison test (C). Source data are provided as a Source Data file.
Fig. 2
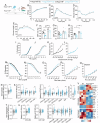
Fig. 2. Deletion of Nogo-A/B improves hepatic glucose metabolism without affecting body weight in lean mice.
A Schematic representation of the experimental design. All the analysis in this figure were conducted on male WT and Nogo-A/B-deficient mice SD-fed for 6 months (Created in BioRender. Di Lorenzo, A. (2025) https://BioRender.com/i50g226). B Body weight (n = 18 mice per group), C Fat mass, lean mass and total water content (n = 5 mice per group). D Total, dark phase, and light phase food intake, expressed as average of 3 consecutive days (n = 5 mice per group). E Plasma glucose levels after o.n. starvation (WT SD n = 14 mice and Nogo-A/B-deficient SD n = 9 mice). F GTT (WT SD n = 19 mice and Nogo-A/B-deficient n = 13 mice) and G ITT (n = 9 mice per group). H Plasma insulin levels pre- and post-glucose administration (i.p., 1.5 g/kg). (WT SD n = 8 mice and Nogo-A/B-deficient SD n = 7 mice). I Immunofluorescence staining for glucagon, insulin and NOGO-A/B in pancreatic sections of SD WT mice. Nogo-A/B-deficient pancreas were used as negative controls. J PTT (WT SD n = 15 mice and Nogo-A/B-deficient SD n = 8 mice) and K G6Pase mRNA levels in the liver (n = 5 mice per group). L PTT in WT and Nogo-A/B-deficient mice treated with vehicle or Myriocin (0.3 mg/kg, o.n.) (WT SD vehicle n = 8 mice, WT SD treated with myriocin n = 10, Nogo-A/B-deficient SD vehicle n = 8 mice and Nogo-A/B-deficient SD treated with myriocin n = 10). M Immunohistochemistry for NOGO-A/B in liver of lean mice. Nogo-A/B deficient liver were used as negative control. N Glucose production from hepatocytes isolated from WT mice, treated with vehicle or S1P (1 μM, 6 h), and/or W146 (1 μM, 6 h) (n = 3 independent experiments). O PTT in WT male mice on SD after 30 min from intraperitoneal administration of W146 (3 mg/kg) or vehicle (DMSO:water, 1:1) after o.n. starvation (WT SD vehicle n = 6 mice, WT SD treated with W146 n = 8, Nogo-A/B-deficient SD vehicle n = 5 mice and Nogo-A/B-deficient SD treated with W146 n = 7). Data were expressed as mean ± SEM. *p ≤ 0.05, **p ≤ 0.01, ***p ≤ 0.001. Statistical analysis was performed with unpaired t-test two-tailed (BE, K), one-way ANOVA (N) and two-way ANOVA with Sidak multiple comparisons test (F, G, H, J, L, O). Source data are provided as a Source Data file.
Fig. 3
Fig. 3. Deletion of Nogo-A/B ameliorates diet-induced obesity and diabetes.
A Schematic representation of the experimental design. All the analysis were performed in male WT and Nogo-A/B-deficient mice HFD-fed for 6 months (Created in BioRender. Di Lorenzo, A. (2025) https://BioRender.com/i50g226). B Body weight (n = 19 mice per group). C Fat mass, lean mass, and total water content (n = 5 mouse per group). D Plasma leptin levels (WT HFD n = 9 mice and Nogo-A/B-deficient HFD n = 10 mice). E Total, dark phase, and light phase food intake, expressed as average of 3 consecutive days (n = 5 mice per group). F Plasma glucose levels after o.n. starvation (WT HFD n = 16 mice and Nogo-A/B-deficient HFD n = 20 mice). G GTT (WT HFD n = 25 mice and Nogo-A/B-deficient HFD n = 19 mice). H ITT (WT HFD n = 27 mice and Nogo-A/B-deficient HFD n = 26 mice). I Plasma insulin levels pre- and post-glucose administration (i.p.; 1.5 g/kg) (WT HFD n = 17 mice and Nogo-A/B-deficient HFD n = 25 mice). J PTT (WT HFD n = 16 mice and Nogo-A/B-deficient HFD n = 15 mice). K Immunohistochemistry for NOGO-A/B in liver of WT mice HFD-fed for 6 months. Nogo-A/B deficient liver were used as negative control. L Liver weight (n = 19 mice per group). M Triglyceride levels (n = 5 mice per group). Data were expressed as mean ± SEM. *p ≤ 0.05, **p ≤ 0.01, ***p ≤ 0.001. Statistical analysis was performed with unpaired t-test two-tailed (C, D, E, F, L, M), one-way ANOVA (I), and two-way ANOVA with Sidak multiple comparisons test (B, G, H, J). Source data are provided as a Source Data file.
Fig. 4
Fig. 4. The loss of Nogo-A/B lowers blood pressure in both lean and obese mice.
A Radiotelemetry measurements of blood pressure (BP) (Created in BioRender. Di Lorenzo, A. (2025) https://BioRender.com/i50g226). Systolic BP (SBP; B), diastolic BP (DBP; C), and mean BP (MBP; D) were measured by radiotelemetry for 3 consecutive days following the recovery from surgery of ca. 12 days. (Nogo-A/B-deficient SD, n = 6 mice; Nogo-A/B-deficient HFD, n = 9 mice, WT SD and HFD, n = 10 mice per group). Data were expressed as mean ± SEM. *p ≤ 0.05, **p ≤ 0.01, ***p ≤ 0.001. Statistical analysis was performed with two-way ANOVA with Sidak multiple comparisons test. Source data are provided as a Source Data file.
Fig. 5
Fig. 5. Deletion of Nogo-A/B protects from vascular dysfunction by preserving sphingolipid levels.
A Vascular function of mesenteric arteries (MA) was assessed in WT or Nogo-A/B-deficient mice fed with SD or HFD for 6 months by using the pressure myograph system (Danish MyoTechnology, Aarhus, Denmark), (Created in BioRender. Di Lorenzo, A. (2025) https://BioRender.com/i50g226). B Ach-mediated vasodilation (WT SD n = 6 mice, Nogo-A/B-deficient SD n = 4 mice, WT HFD n = 6 mice, Nogo-A/B-deficient HFD n = 6 mice); C Flow-induced vasodilation (WT SD n = 6 mice, Nogo-A/B-deficient SD n = 5 mice, WT HFD n = 5 mice, Nogo-A/B-deficient HFD n = 6 mice). HFD MA of WT or Nogo-A/B-deficient mice were incubated with W146 (300 nM, 30 min), an S1P1 inhibitor (WT SD n = 6 mice, Nogo-A/B-deficient SD n = 5 mice, WT HFD n = 5 mice, Nogo-A/B-deficient HFD n = 6 mice, WT HFD n = 4 mice and Nogo-A/B-deficient HFD n = 3 mice treated with W146); D, E PE-induced vasoconstriction (WT SD n = 6 mice, Nogo-A/B-deficient SD n = 4 mice, WT HFD n = 6 mice, Nogo-A/B-deficient HFD n = 6 mice); F myogenic tone (WT SD n = 7 mice, Nogo-A/B-deficient SD n = 4 mice, WT HFD n = 6 mice and Nogo-A/B-deficient HFD n = 6 mice); and G AngII-induced vasoconstriction (WT SD n = 4 mice, Nogo-A/B-deficient SD n = 4 mice, WT HFD n = 4 mice and Nogo-A/B-deficient HFD n = 4 mice) in MA. LC–MS/MS quantification of H total and I specific Cer, and of J total and K specific SM in MA (WT HFD n = 11 mice, Nogo-A/B-deficient HFD n = 9 mice). Data are expressed relative to WT HFD. L WB analysis of p-MLC (Ser19), MLC, p-MYPT1 (Thr696), MYPT1 and NOGO-B in MA from obese WT or Nogo-A/B-deficient mice, with or without AngII stimulation (10−7M, 20 s) and M, N relative quantification (n = 4 mice per group). Data were expressed as mean ± SEM. *p ≤ 0.05, **p ≤ 0.01, ***p ≤ 0.001. Statistical analysis was performed with two-way ANOVA with Sidak multiple comparisons test (BG) and unpaired t-test two tailed (HK, M, N). Source data are provided as a Source Data file.
Fig. 6
Fig. 6. Endothelial-specific deletion of Nogo-B improves metabolic and vascular dysfunction.
A Schematic representation of the experimental design. Metabolic and vascular functions were assessed in Nogo-A/Bf/f or Nogo-A/BECKO mice fed with SD or HFD for 6 months (Created in BioRender. Di Lorenzo, A. (2025) https://BioRender.com/i50g226). B Body weight (Nogo-A/Bf/f HFD n = 8 mice and Nogo-A/BECKO HFD n = 10 mice). C GTT (Nogo-A/Bf/f HFD n = 15 mice and Nogo-A/BECKO HFD n = 17 mice). D ITT (Nogo-A/Bf/f HFD n = 8 mice and Nogo-A/BECKO HFD n = 10 mice). E PTT (Nogo-A/Bf/f HFD n = 8 mice and Nogo-A/BECKO HFD n = 8 mice). F SBP, G DBP, and H MBP measured by radiotelemetry as described in Methods (Nogo-A/Bf/f SD n = 5 mice, Nogo-A/BECKO SD n = 5 mice, Nogo-A/Bf/f HFD n = 7 mice and Nogo-A/BECKO HFD n = 5 mice). I, J PE-induced vasoconstriction (Nogo-A/Bf/f SD n = 8 mice, Nogo-A/BECKO SD n = 10 mice, Nogo-A/Bf/f HFD n = 4 mice and Nogo-A/BECKO HFD n = 5 mice). K, L Myogenic tone (Nogo-A/Bf/f SD n = 8 mice, Nogo-A/Bf/f HFD n = 4 mice, Nogo-A/BECKO SD n = 5 mice and Nogo-A/BECKO HFD n = 7 mice). M, N Ach-mediated vasodilation (Nogo-A/Bf/f SD n = 11 mice, Nogo-A/BECKO SD n = 10 mice, Nogo-A/Bf/f HFD n = 7 mice and Nogo-A/BECKO HFD n = 8 mice); O, P flow-induced vasodilation (Nogo-A/Bf/f SD n = 7 mice, Nogo-A/BECKO SD n = 8 mice, Nogo-A/Bf/f HFD n = 6 mice and Nogo-A/BECKO HFD n = 8 mice), and Q flow-induced vasodilation after myriocin treatment (1 mg/kg, i.v., o.n.), (n = 3 mice per group). LC–MS/MS quantification of R total and S specific Cer, C16:0-dihydroceramide (dhC16:0-Cer), dihydrosphingosine (dhSph), sphingosine (Sph), sphingosine-1-phosphate (S1P), and T total and U specific SM in EC FACS-sorted from heart and lung of Nogo-A/B-deficient and WT mice fed with HFD for 6 months. Data are expressed relative to WT HFD (Nogo-A/Bf/f HFD n = 18 mice and Nogo-A/BECKO HFD n = 17 mice). V Heatmap of gene for the SPT complex, inflammation, and lipid transport in FACS-sorted EC from heart and lung, *indicates significant differences (Nogo-A/Bf/f HFD n = 4 mice and Nogo-A/BECKO HFD n = 4 mice). Data were expressed as mean ± SEM. *p ≤ 0.05, **p ≤ 0.01, ***p ≤ 0.001. Statistical analysis was performed with two-way ANOVA with Sidak multiple comparisons test (B, C, D, E, IQ), one-way ANOVA (FH) unpaired t-test two-tailed (RU). Source data are provided as a Source Data file.
Fig. 7
Fig. 7. The inhibition of ceramide de novo biosynthesis by Nogo-B in HFD mice results in the suppression of both ceramide and S1P, contributing to vascular and metabolic disorders.
(Created in BioRender. Di Lorenzo, A. (2025) https://BioRender.com/i50g226).

References

    1. Powell-Wiley, T. M. et al. Obesity and cardiovascular disease: a scientific statement from the American Heart Association. Circulation143, e984–e1010 (2021). - PMC - PubMed
    1. Hadi, H. A. & Suwaidi, J. A. Endothelial dysfunction in diabetes mellitus. Vasc. Health Risk Manag.3, 853–876 (2007). - PMC - PubMed
    1. Al Suwaidi, J., Higano, S. T., Holmes, D. R. Jr., Lennon, R. & Lerman, A. Obesity is independently associated with coronary endothelial dysfunction in patients with normal or mildly diseased coronary arteries. J. Am. Coll. Cardiol.37, 1523–1528 (2001). - PubMed
    1. Sasset, L. & Di Lorenzo, A. Sphingolipid metabolism and signaling in endothelial cell functions. Adv. Exp. Med. Biol.1372, 87–117 (2022). - PubMed
    1. Graupera, M. & Claret, M. Endothelial cells: new players in obesity and related metabolic disorders. Trends Endocrinol. Metab.29, 781–794 (2018). - PubMed

LinkOut - more resources