. 2025 Feb 25;16(1):1965.
doi: 10.1038/s41467-025-56833-7.

A single-cell atlas to map sex-specific gene-expression changes in blood upon neurodegeneration

Affiliations

A single-cell atlas to map sex-specific gene-expression changes in blood upon neurodegeneration

Friederike Grandke et al. Nat Commun. .

Abstract

The clinical course and treatment of neurodegenerative disease are complicated by immune-system interference and chronic inflammatory processes, which remain incompletely understood. Mapping immune signatures in larger human cohorts through single-cell gene expression profiling supports our understanding of observed peripheral changes in neurodegeneration. Here, we employ single-cell gene expression profiling of over 909k peripheral blood mononuclear cells (PBMCs) from 121 healthy individuals, 48 patients with mild cognitive impairment (MCI), 46 with Parkinson's disease (PD), 27 with Alzheimer's disease (AD), and 15 with both PD and MCI. The dataset is interactively accessible through a freely available website ( https://www.ccb.uni-saarland.de/adrcsc ). In this work, we identify disease-associated changes in blood cell type composition and the gene expression in a sex-specific manner, offering insights into peripheral and solid tissue signatures in AD and PD.


Conflict of interest statement

Competing interests: A.K. was advisor of the company Firalis, researching RNA-based biomarkers for AD, while preparing the manuscript. C.L., Q.S., Y.L., C.C., Y.Y., J.X., M.J., Z.W., T.W., L.L., and Y.H. work for the company MGI group while working on the project. The remaining authors declare no competing interests.

Figures
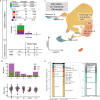
Fig. 1
Fig. 1. Cohort and single-cell data characterization.
a Overview on the dataset. PBMC samples were collected from healthy patients (HC), patients with Parkinson’s Disease (PD), and patients with Cognitive Impairment (CI), more detailed with Mild Cognitive Impairment (MCI), Alzheimer’s Disease (AD), and Parkinson’s Disease with Mild Cognitive Impairment (PD-MCI). For a subset of patients, blood samples were drawn at multiple time-points. The samples were then profiled using single-cell RNA sequencing. For a subset of patients, additional data was collected on brain volumes (158 patients) and known Alzheimer biomarkers were measured in the CSF (40 patients). b Distribution of biological sex and age per patient group (divided by sex). The violin plots show the shape of the distribution, while the boxes encompass the first through third quartiles, with the central line marking the median. The whiskers mark the minimum or maximum values or, if outliers are present, the values within 1.5 times the interquartile range of the first or third quartile. Outliers are shown as dots. c Two-dimensional representation of the n = 909k cells using Uniform Manifold Approximation and Projection (UMAP). Cells are colored by assigned cell type. d Cells are annotated on different levels. This allows the analysis on a broad level with 13 bigger clusters or on a finer level with 33 clusters.
Fig. 2
Fig. 2. Sex-dependent changes of cell type proportions.
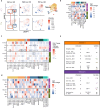
a Differential density UMAP embedding for male and female patients shows differences in the cell type distribution for AD, PD and MCI. Each embedding shows the spots with the highest density of the diseased patient group (red) or the healthy control group (blue). b Comparison of the cell type proportions (on the broad annotation) using scCODA with Age and ApoE as covariates. Celltypes with an absolute Fold-change of at least 0.5 that were reported as significant by scCODA are marked with a dot. c Relative change in the cell type-proportion in % between Healthy and the diagnosis groups for the different cell types reveals sex-specific changes. Significant values (adj. p-value < 0.05, unpaired Student’s t-test) are marked by a frame, previously described changes from the literature are marked with a dot. d Comparison of the changes of cell type proportions found in the literature and the cell type proportion changes found in our PBMC data using scCODA. Changes are only considered if they were reported as significant by scCODA between healthy and disease. If no sex is given, the test was performed without considering the sex. e Comparison of the cell type proportions on the fine Annotation using scCODA as described in (b). Celltypes with an absolute Fold-change of at least 1 that were reported as significant by scCODA are marked with a dot.
Fig. 3
Fig. 3. Changes in gene-expression patterns in male and female patients.
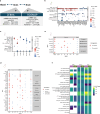
a Comparison of the number of genes that are significantly de-regulated (adj. p-value < 0.05 and absolute log2 fold-change > 0.5, see Methods) between the healthy and diseased patients in females and in males. b Cell types with more significantly de-regulated genes (as in a) show higher correlation values in AD and MCI. The Pearson correlation coefficient was calculated between the fold-changes in male and female of all genes in the dataset. c Correlations of the fold-changes in male and female patients in PD is often lower and in 9 cell types negative, but positive in most cell types in MCI and AD. Significant values (Pearson’s correlation, adj. p-value < 0.05) are marked with a dot. d Comparison of the log2 Fold-changes in male and female patients in CD4+ Tcm/Tscm cells and NKT-like cells shows the number of genes that are significantly de-regulated in both or only one sex. The genes are colored by the sex in which they are significant in (adj. p-value < 0.05, see Methods). e, f Upset plot showing the number of significantly de-regulated genes that are shared between the different comparisons of healthy with the diagnosis groups for the male sub-group (e) and for the female sub-group (f) show similar patterns in the overlap between diseases in both sexes.
Fig. 4
Fig. 4. Pathways analysis shows sex-dependent changes in PD and MCI.
a The number of cell types in which a pathway is enriched or depleted in males and females in the different comparisons. The dots are colored if they occur only in males or in females. b Number of occurrences of the top 5 most frequently enriched and depleted pathways in each comparison and sex. c, d Size of the overlap of the pathways in the different comparisons, independent of cell type for males (c) and females (d).
Fig. 5
Fig. 5. Comparison of gene-expression in brain and blood of Alzheimer’s patients.
a Single-cell RNA-sequencing data from the cortex from the ZEBRA-dataset was used for the comparison of changes in PBMC samples and brain samples. b Fold-changes in PBMCs and cortex of the genes with an adj. p-value < 0.05 (see Methods) in the PBMCs the brain in males. c De-regulation of genes in PBMCs and cortex with an adj. p-value < 0.05 in PBMCs and the brain and an abs. log2 fold-change bigger than 0.6 in the PBMCs (see Methods). d, e Deregulation of the significantly de-regulated genes in all three datasets (see Methods) and the direction of de-regulation in males (d) and females (e) ( + : Up-regulated in all cell-types, -: Down-regulated in all cell-types and *: Mixed signals). Genes are annotated with the context in which they have been previously reported in for Alzheimer’s (see Supplementary Table 3). f Top 10 most frequently enriched or depleted pathways in both brain datasets and in PBMCs and the proportion of cell-types they are enriched/depleted in.

References

    1. Scheltens, P. et al. Alzheimer’s disease. Lancet397, 1577–1590 (2021). - PMC - PubMed
    1. Bloem, B. R., Okun, M. S. & Klein, C. Parkinson’s disease. Lancet397, 2284–2303 (2021). - PubMed
    1. Hou, Y. et al. Ageing as a risk factor for neurodegenerative disease. Nat. Rev. Neurol.15, 565–581 (2019). - PubMed
    1. Gan, L., Cookson, M. R., Petrucelli, L. & La Spada, A. R. Converging pathways in neurodegeneration, from genetics to mechanisms. Nat. Neurosci.21, 1300–1309 (2018). - PMC - PubMed
    1. Jessen, F. et al. The characterisation of subjective cognitive decline. Lancet Neurol.19, 271–278 (2020). - PMC - PubMed

MeSH terms

LinkOut - more resources