

Prevention of tuberculosis in cynomolgus macaques by an attenuated Mycobacterium tuberculosis vaccine candidate
- PMID: 40000643
- PMCID: PMC11861635
- DOI: 10.1038/s41467-025-57090-4
Prevention of tuberculosis in cynomolgus macaques by an attenuated Mycobacterium tuberculosis vaccine candidate
Abstract
The need for novel vaccination strategies to control tuberculosis (TB) is underscored by the limited and variable efficacy of the currently licensed vaccine, Bacille Calmette-Guerin (BCG). SigH is critical for Mycobacterium tuberculosis (Mtb) to mitigate oxidative stress, and in its absence Mtb is unable to scavenge host oxidative/nitrosative bursts. The MtbΔsigH (ΔsigH) isogenic mutant induces signatures of the innate immunity in macrophages and protects rhesus macaques from a lethal Mtb challenge. To understand the immune mechanisms of protection via mucosal vaccination with ΔsigH, we employed the resistant cynomolgus macaque model; and our results show that ΔsigH vaccination significantly protects against lethal Mtb challenge in this species. ΔsigH-vaccinated macaques are devoid of granulomas and instead generate inducible bronchus associated lymphoid structures, and robust antigen-specific CD4+ and CD8+ T cell responses, driven by a hyper-immune, trained immunity-like phenotype in host macrophages with enhanced antigen presentation. Correlates of protection in ΔsigH-vaccinated macaques include gene signatures of T cell activation, IFNG production, including IFN-responsive, activated T cells, concomitant with IFNG production, and suppression of IDO+ Type I IFN-responsive macrophage recruitment. Thus, ΔsigH is a promising lead candidate for further development as an antitubercular vaccine.
© 2025. The Author(s).
Conflict of interest statement
Competing interests: All authors declare no competing interests.
Figures
 ), BCG (
 ) and ΔsigH-vaccinated (
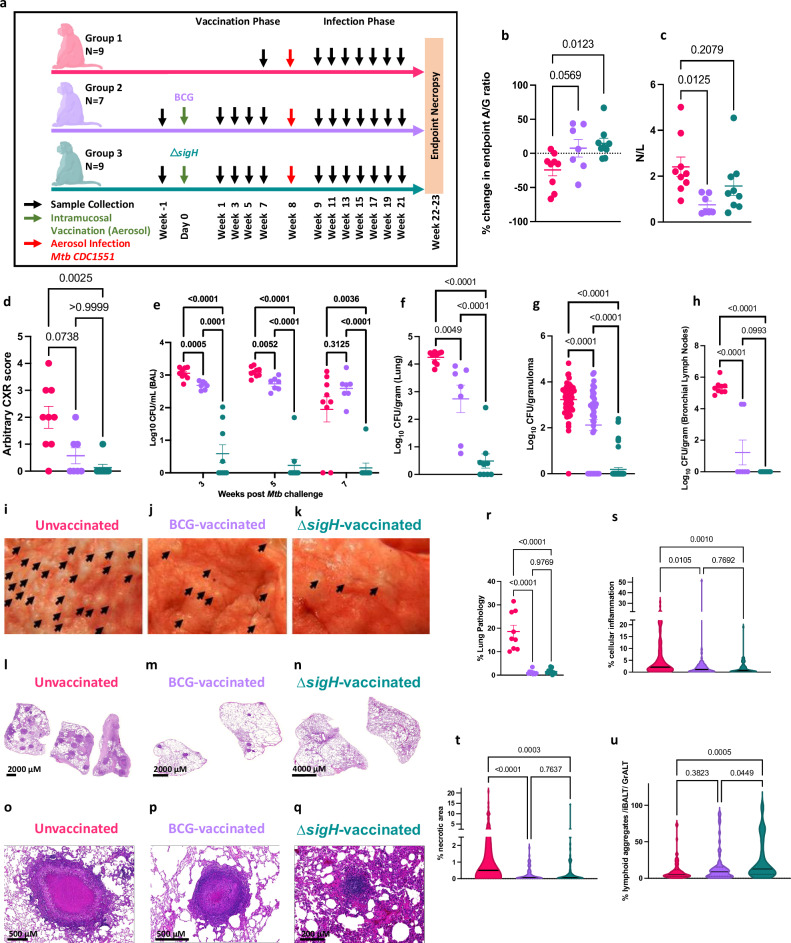
 ) CMs post-Mtb infection. The schematics were created using BioRender. Shown are endpoint serum Albumin/Globulin (A/G) ratios (b); blood Neutrophil (N)/Lymphocyte (L) ratios (c) and CXR scores (d); longitudinal BAL Colony Forming Units (CFUs) (e); endpoint lung (f), lung granuloma (g), and bronchial lymph node (h) CFUs per gram. Gross pathology in representative unvaccinated (i), BCG- (j) and ΔsigH-vaccinated (k) with granulomas (black arrows). Representative sub-gross histopathology and histopathology of unvaccinated (l, o), BCG- (m, p) and ΔsigH-vaccinated (n, q) CM lungs. Unvaccinated: Multiple confluent necrotic granulomas (o), BCG-vaccinated: (p) and ΔsigH -vaccinated: Solitary non-necrotic small granuloma with lymphoid hyperplasia and iBALT (q). Morphometric lung pathology score in the three groups (r). Percentage of cellular inflammation (s), necrotic region (t) and lymphoid aggregates (u), across multiple fields of view of lung tissue using HALO (Indica Labs). Data is presented as mean ± standard error of mean (SEM) and P-values were calculated by one-way ANOVA with Tukey’s correction, except for (d) where a two-way ANOVA with Tukey’s correction was used.
 ) or ΔsigH- (
 ) vaccinated CMs. Each column represents an individual macaque (n = 5). Frequencies of CCR5+ and CXCR3+ - CD3+ (e, i), CD4+ (f, j), and CD8+ (g, k) T cells and B cells (h) in BAL. Frequencies of CCR6+ CD3+ (l), CD4+ (m) and CD8+ (n) T cells in BAL. Frequencies of CXCR3+CCR6+ CD4+ (o) and CD8+ T cells in BAL (p); effector (q), memory (r) and naïve (s) CD4+ T cells, CD69+ (t) and KI67+ (u) effector CD4+ T cells, CCR5+ (v), CCR7+ (x) and KI67+(z) memory CD4+ T cells and CCR5+ (w), CCR7+ (y) and KI67+(a’) memory CD8+ T cells in BAL at weeks 3, 5, and 7 post-vaccination time-point, expressed as percentage of parental population. Results are shown for weeks 3, 5, and 7 post-vaccination time-point (n = 5). Each column represents an individual macaque.
 ) or ΔsigH (
 ) are shown. Frequencies of CD4+ and CD8+ T cells expressing IFNG (k, p), TNFA (l, q), IFNG and TNFA (m, r), GZMB (n, s) and IL17 (o, t) in response to pooled peptide pools of Mtb ESAT6 and CFP10 (EC). Each column represents an individual macaque (n = 5) at weeks 3, 5, and 7 post-vaccination.
 ) or ΔsigH (
 ) -vaccinated groups showing cluster 0 (d), cluster 1 (e), cluster 2 (f), cluster 3 (g), cluster 4 (h), cluster 5 (i), cluster 6 (j), cluster 7 (k), cluster 8 (l), and cluster 9 (m). Data is presented as mean ± SEM and P-values are derived from Mann-Whitney U test.
 ) or ΔsigH (
 )—vaccination groups three weeks post-vaccination. The color of each dot indicates the normalized expression level, while the dot size represents the percentage of cells within that cluster expressing the corresponding gene. To identify cluster-specific markers, we compared the gene expressions of each cluster against all other clusters combined using Wilcoxon rank-sum tests, with Bonferroni correction for multiple hypothesis testing with adjusted p-value threshold of 0.05.
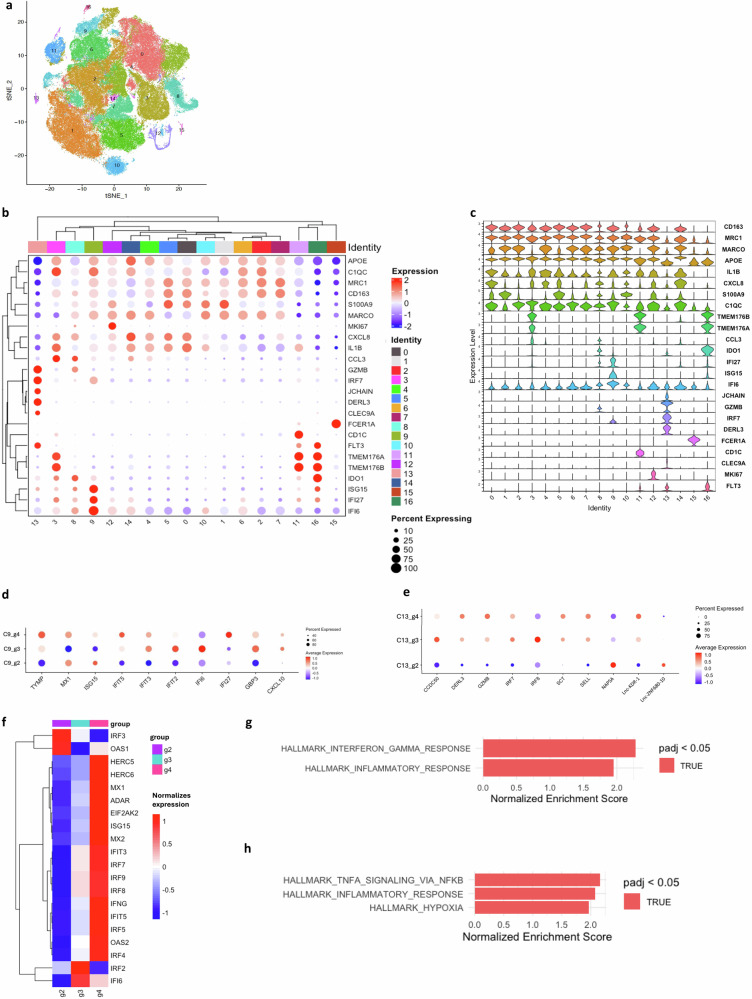

 ) and CDC1551 Mtb (
 ) (MOI = 1) for 4 hours. a On days indicated HMΦs were lysed and plated for CFU counts on 7H11 agar. b–c Two pools (n = 3 M and n = 3 F each) of donor derived HMΦs were infected as above and subjected to RNAseq at 18 hours post infection (Novogene USA). Heatmaps show fragments per kilobase million (FPKM). Data were analyzed using Reactome and Kyoto encyclopedia of genes and Genomes (KEGG) workflows followed by GSEA analysis. Reactome analysis of ∆sigH induced genes vs. those induced by Mtb shown and enriched gene modules are highlighted. TRIzol lysates of preparations from panel-a were used for RT-PCR analysis using primers (Table S4) for ATG5 (d), ATG7 (e), GBP1 (f), GBP2 (g) genes. Uninfected samples are shown in
  . h–i
. h–i
 labeled live ∆sigH and Mtb were phagocytosed into HMΦs followed by immunofluorescent labeling using monoclonal antibody (mab) to microtubule associated loath chain-3 biomarker of autophagosomes (
 ) or isotype. Colocalization was acquired using an N90 Nikon fitted with Metaview software. Fifty HMΦs in triplicates per organism were counted blind for colocalizing phagosomes and averaged from two independent experiments. j Three pools (n = 2/pool) of HLA-DR1+ HMΦs were infected with ∆sigH and Mtb (MOI = 1) washed, and one set lysed immediately to plate for CFU counts. Replicate set was overlaid using (1:1) F9A6 CD4+ T cell hybridoma that secretes IL-2 upon recognition of Ag85B derived peptide epitope. IL-2 in the supernatant collected at 48 and 72 hours post overlay was measured using sandwich ELISA. k Replicate antigen presentation assay was done using HLA-DR1+ HMΦs in which beclin1 has been knocked down 24 hours earlier using a siRNA probe (Origene, USA). Data is presented as mean ± SEM and P-values are derived from multiple Mann-Whitney tests (one-way) with multiple hypothesis correction by false discovery rate method of Benjamini, Kreiger and Yekutielli (two stage step up).
 ), BCG (
 )- and ΔsigH-vaccinated (
 )], post-Mtb infection, shown are the frequencies of lung granuloma derived CD4+ T cells (a), expressed as percentage of all CD3+ cells. Frequency of lung granuloma derived naïve (b) and memory (c) CD4+ T cells, expressed as percentage of the parental population. Within the memory CD4+ T cell pool, shown are the frequencies of CD69+ (d) and KI67+ (e). Within the effector CD4+ T cell pool, shown is the frequencies of CD69+ (f). The frequency of CD69+ (g) is also shown for the parental CD4+ T cell pool. Frequencies of lung granuloma derived CD8+ T cells (h), expressed as percentage of all CD3+ cells. Frequency of lung granuloma derived naïve (i) and memory (j) CD8+ T cells, expressed as percentage of the parental population. Frequencies of lung granuloma derived CD8+ CD69+ T cells (k), expressed as percentage of parental population. Frequency of lung granuloma derived CD8+ memory CD69+ T (l) and CD8+ memory CCR5+ (m) T cells, expressed as percentage of the parental population. Frequency of lung granuloma derived CD8+ Effector CD69+ T cells (n), expressed as percentage of the parental population. Frequency of lung granuloma derived B cells (o) is shown along with CCR5+ (p), CD69+ (q) and KI67+ (r) B cells, expressed as percentage of the parental population. Data is presented as mean ± SEM and P-values were calculated by one-way ANOVA with Tukey’s correction.
 ) cells in this section which do not exhibit the expression of classical myeloid (CD68, CD163, CD206) markers, and which are lineage (CD45) negative, interact with cells positive for structural markers—Collagen IV (
 ), E-cadherin (
 ) and vimentin (
 ). d CyCIF staining image from a representative lung section from a ΔsigH vaccinated, Mtb challenged macaque, showing staining with the most prominent markers in this group: CD20 (
 ), CD4 (
 ), CD19 (
 ) and PAX5 (
 ) and nuclear stain DAPI (
 ). e Staining of the same section with all 27 antibodies. f Intense staining of the section with iBALT markers clearly delineates B cell—T cell zones. g–h Comparative characterization of correlation matrices from CyCIF staining of unvaccinated (g) and ΔsigH -vaccinated (h) lung sections. i–j Identification of cellular phenotypes based on protein expression results from CyCIF in unvaccinated (i) and ΔsigH -vaccinated (j) lung sections. Frequency of various subpopulations of cytotoxic (k) and helper T cells (l), B cells (m) in unvaccinated (
 ) and ΔsigH -vaccinated (
 ) lung sections. Comparison of cellular neighborhoods in unvaccinated (n) and ΔsigH -vaccinated (o) lung sections.
References
-
- Organization, W. H. Global tuberculosis report 2023. (Geneva: World Health Organization, 2023).
MeSH terms
Substances
Grants and funding
- R01AI111914/Division of Intramural Research, National Institute of Allergy and Infectious Diseases (Division of Intramural Research of the NIAID)
- R01 AI111914/AI/NIAID NIH HHS/United States
- R01AI134240/Division of Intramural Research, National Institute of Allergy and Infectious Diseases (Division of Intramural Research of the NIAID)
- P30 AI161943/AI/NIAID NIH HHS/United States
- R01 AI134240/AI/NIAID NIH HHS/United States
- P51 OD011133/OD/NIH HHS/United States
- S10 OD032443/OD/NIH HHS/United States
- S10 OD028653/OD/NIH HHS/United States
- R01AI138587/Division of Intramural Research, National Institute of Allergy and Infectious Diseases (Division of Intramural Research of the NIAID)
- P30 AI168439/AI/NIAID NIH HHS/United States
- S10 OD028732/OD/NIH HHS/United States
- R01 AI184623/AI/NIAID NIH HHS/United States
- R01 AI138587/AI/NIAID NIH HHS/United States
- U42 OD010442/OD/NIH HHS/United States
LinkOut - more resources
Full Text Sources
Medical
Research Materials
