. 2025 Feb 25;16(1):1712.
doi: 10.1038/s41467-025-56970-z.

Detection of ferrihydrite in Martian red dust records ancient cold and wet conditions on Mars

Affiliations

Detection of ferrihydrite in Martian red dust records ancient cold and wet conditions on Mars

Adomas Valantinas et al. Nat Commun. .

Abstract

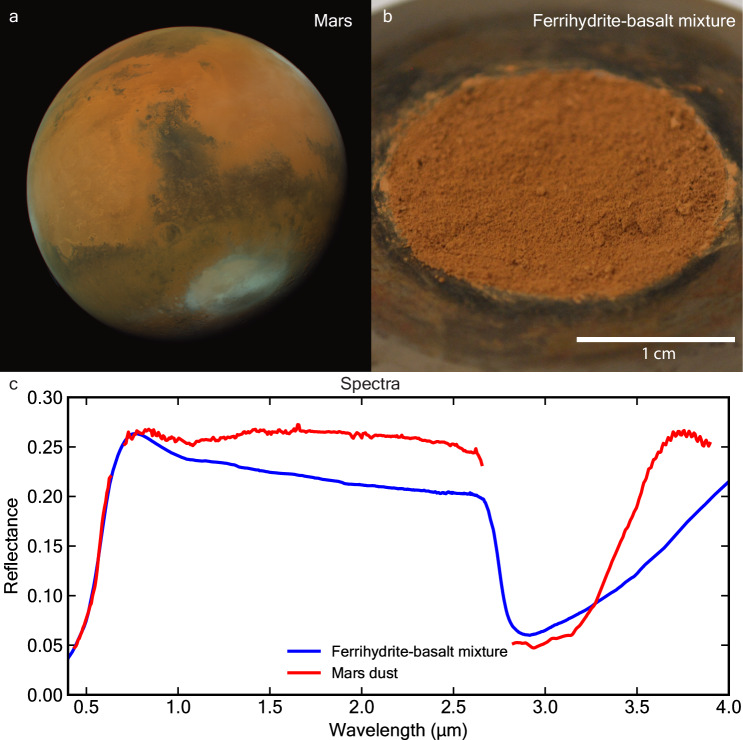
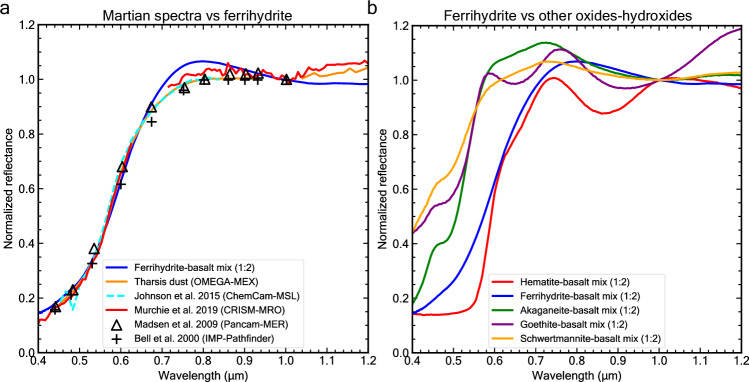
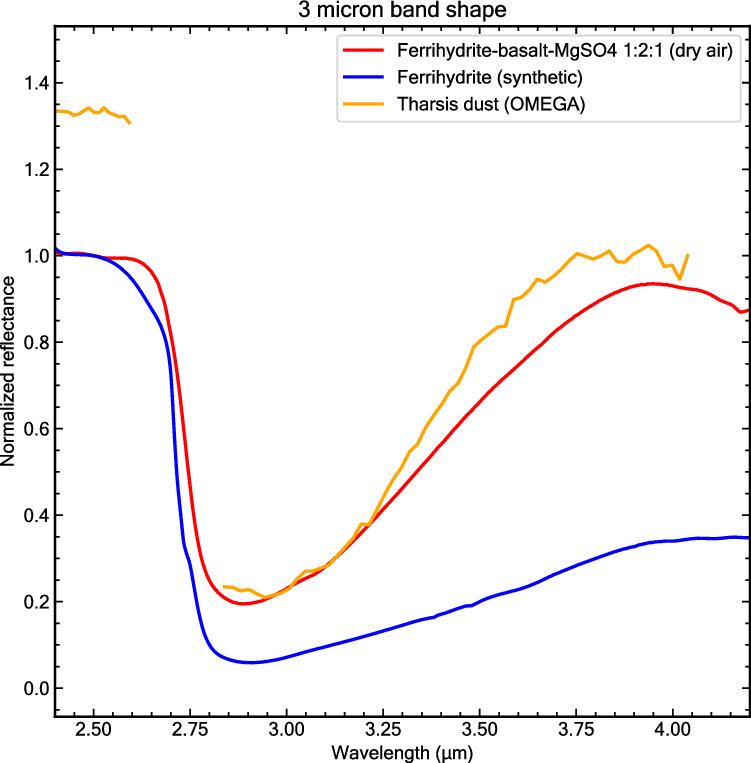
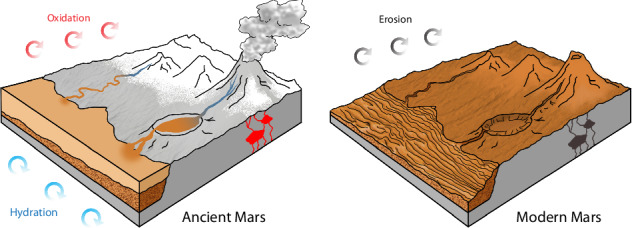
Iron oxide-hydroxide minerals in Martian dust provide crucial insights into Mars' past climate and habitability. Previous studies attributed Mars' red color to anhydrous hematite formed through recent weathering. Here, we show that poorly crystalline ferrihydrite (Fe5O8H · nH2O) is the dominant iron oxide-bearing phase in Martian dust, based on combined analyses of orbital, in-situ, and laboratory visible near-infrared spectra. Spectroscopic analyses indicate that a hyperfine mixture of ferrihydrite, basalt and sulfate best matches Martian dust observations. Through laboratory experiments and kinetic calculations, we demonstrate that ferrihydrite remains stable under present-day Martian conditions, preserving its poorly crystalline structure. The persistence of ferrihydrite suggests it formed during a cold, wet period on early Mars under oxidative conditions, followed by a transition to the current hyper-arid environment. This finding challenges previous models of continuous dry oxidation and indicates that ancient Mars experienced aqueous alteration before transitioning to its current desert state.


Conflict of interest statement

Competing interests: The authors declare no competing interests.

Figures

Fig. 1
Fig. 1. Identification of ferrihydrite in the Martian dust.
a Ochre hue in the light-toned regions of Mars (as observed on 2021-08-14 by the Emirates Exploration Imager; R = 635, G = 546 and B = 437 nm), b ferrihydrite-basalt (1:2 ratio) laboratory hyperfine ( < 1 µm) mixture acquired under ambient conditions in a sample dish, and c comparison of an orbital spectrum of Martian dust (from CRISM image FRT00009591) to the spectrum of the ferrihydrite-basalt mixture. The steep increase in reflectance near 0.5 µm is due to the presence of ferric iron and its electron pair transition absorption, which dominates the UV range and extends into the blue wavelengths. The NIR spectral bands at 1.41 and 1.93 µm due to bound H2O in ferrihydrite are not observed in spectra of these hyperfine mixture samples. The characteristic NIR increase in reflectance (1–2.5 µm) in spectra of pure ferrihydrite (see Fig. 3) is also not observed in our mixture spectra, likely due to nonlinear spectral mixing with the basalt powder. The 3-µm band may be due to chemically bound water in both the Martian dust and the lab sample. Source data are provided as a Source Data file.
Fig. 2
Fig. 2. Spectral evidence for ferrihydrite in Martian dust from multiple missions.
a Martian spectra vs lab ferrihydrite-basalt mixture and b ferrihydrite-basalt spectrum vs hematite-, schwertmannite-, akaganeite- and goethite-basalt mixture spectra. The ferrihydrite-basalt spectrum provides a better fit to the orbital (CRISM, OMEGA) and in-situ (ChemCam, Pancam, IMP) observations of Martian dust than other iron oxide/hydroxide mixture spectra. Note that other hematite-basalt weight ratios can not reproduce the Martian dust spectrum (Supplementary Fig. 5). The ChemCam-MSL dust spectrum was acquired from the observation of a dusty rock named “119_Rifle_8” in Gale Crater. The CRISM-MRO spectrum of dust was attained from the Olympus Mons summit observation FRT0000790. The OMEGA-MEX spectrum was collected from the dusty Tharsis region observation orb3741_4. The Pancam-MER multi-band spectrum “B207:Sw, d1” is of airfall dust on the sweep magnet in Meridiani Planum. The IMP-Pathfinder multi-band spectrum was acquired in Ares Vallis and is termed “Surface Dust 21_2”. Source data are provided as a Source Data file.
Fig. 3
Fig. 3. Non-linear reflectance behavior of ferrihydrite-basalt intimate mixtures.
a Ferrihydrite-basalt mixture VNIR spectra with increasing amounts of wt. % ferrihydrite and b same spectra normalized at 1 µm and truncated to highlight variations in the extended visible region. The 0 wt. % spectrum represents the pure hyperfine basalt sample. At least 10 wt. % of ferrihydrite is needed to produce the prominent red slope in the visible (0.5–0.7 µm) wavelength range. These spectra suggest that more than 20 wt. % ferrihydrite (i.e. 1:3 weight ratio) may be needed to fit the Martian spectrum of dust. Already at a 1:1 ratio of ferrihydrite to basalt, the NIR (1.3–2.7 µm) increase in reflectance present in spectra of pure ferrihydrite is not observed, nor are the absorptions due to water near ~1.4 and ~1.9 µm. Source data are provided as a Source Data file.
Fig. 4
Fig. 4. Comparison of observations of Martian dust to lab spectra and RMSE values.
a Comparison of ChemCam, CRISM, OMEGA, and lab ferrihydrite-basalt (1:2) mixture spectra. Mars spectra comparison with the b hematite-basalt (1:2) mixture spectrum, c akaganeite-basalt (1:2) mixture spectrum, and d goethite-basalt (1:2) mixture spectrum. e Bar plot of RMSE values derived between each instrument observation and laboratory spectra. RMSE values indicate that ferrihydrite provides the best fit (low RMSE values) to these Martian spectra. Observations of Martian dust, especially in the ChemCam spectrum, show a small shoulder at ~600 nm, likely due to the 6A1 → 4T2 band at slightly longer wavelengths. Our synthetic ferrihydrite sample lacks this feature but it has been observed in natural ferrihydrite samples (see also our Block Island and Azores natural ferrihydrites, Fig. 5). An alternative explanation is that there may be minor amounts of other iron (oxy)hydroxide phases present in the dust (Supplementary Fig. 9). The RMSE analysis was conducted over the range 500–840 nm, due to the limitation of the ChemCam data spectral range. All spectra shown were normalized at 800 nm.
Fig. 5
Fig. 5. Geologic context and properties of natural and synthetic ferrihydrites.
a Ferrihydrite deposit on a lava cave floor in Gruta Dos Balcões, Terceira island, Azores, Portugal. Iron-rich water was percolating from the basaltic cave ceiling, forming stalactites and depositing on the ground. b Ferrihydrite precipitates in a stream in Block Island, Rhode Island, USA. c X-ray diffraction patterns of natural and synthetic ferrihydrites used in this study. The peaks at 2.56 Å and 1.5 Å are characteristic of 2-line ferrihydrite, demonstrating its poorly crystalline structure. Ferrihydrite from Block Island is impure and contains quartz (SiO2), some illite, chlorite and traces of other minerals. d VNIR spectra showing the variability of natural and synthetic ferrihydrites in the 6A1 → 4T2 band position (dashed black line), compared to ChemCam LIBS spectrum of dust and the resulting spectral shoulder at the 600–650 nm wavelength range. Spectra normalized at 800 nm. Source data are provided as a Source Data file.
Fig. 6
Fig. 6. 3-µm band shape comparison for sulfate-bearing mixture, pure ferrihydrite and Martian dust.
The spectral comparison reveals that the 3-µm band’s long-wavelength wing and particularly its inflection point near 3.8 µm in our ferrihydrite-basalt-sulfate mixture matches the Martian dust spectrum, suggesting the possible presence of sulfates in the Martian dust. Reflectance spectra of both the ferrihydrite-basalt-sulfate mixture and pure ferrihydrite were measured under ambient conditions with dry air purging immediately before each acquisition. Normalized at 2.5 µm. Source data are provided as a Source Data file.
Fig. 7
Fig. 7. 40-day dehydration experiment of pure ferrihydrite.
a Spectra of pure ferrihydrite under dehydrating conditions for almost 1000 h and b background-removed 2 L ferrihydrite X-ray diffraction patterns of before (black) and after (red) dehydration. In a exposure to simulated present-day Mars-like conditions results in significant dehydration and water loss in ferrihydrite, as indicated by the removal of the 1.9-µm band. However, the pure ferrihydrite sample did not change phase nor crystallize as suggested by the XRD analysis in b. The small spectral shift in a from 1.41 to 1.40 µm occurs as adsorbed water (which absorbs light at slightly longer wavelengths) is removed from the system, leaving only structural OH/H2O groups contributing to the absorption band,. Source data are provided as a Source Data file.
Fig. 8
Fig. 8. Orbital observations of Martian surface dust and comparison to laboratory spectrogoniometer measurements.
a Phase curve reflectance ratio in two CaSSIS filters (NIR-940 nm, BLU-479 nm) of observations of dust in Arabia Terra and b same ratios for two sieved synthetic ferrihydrite size fractions. The observed arch in both plots is known as the phase reddening and bluing effect. The color ratios of both the <1 µm size fraction and Martian observations exhibit maxima at approximately 40° phase angle, followed by a distinct decrease at larger angles. In contrast, the <11 µm size fraction lacks a clear inflection point, suggesting particle size-dependent variations in light scattering properties. These observations imply that particle size and/or physical particle properties of Martian dust are similar to <1 µm ferrihydrite particles. Optical depth overall is low in (a) implying that atmospheric effects are not the cause of the trends observed here. Similar reflectance ratio curves are observed for other dusty regions of Mars, which suggests homogenous mixing of dust on a global scale. Source data are provided as a Source Data file.
Fig. 9
Fig. 9. Comparison of major surface processes on ancient and modern Mars.
The left panel depicts ancient Mars during a period of active chemical weathering through hydration and oxidation of basaltic crust to produce ferrihydrite-rich waters. Meltwater runoff triggered by volcanic activity transported insoluble ferric iron into crater lakes and basins to form sedimentary deposits. The right panel shows modern Mars where continuous erosional processes rework sedimentary layers and distribute fine-grained material across the planet to create its characteristic ochre appearance. Schematic not to scale.
Fig. 10
Fig. 10. pe-pH predominance diagram (Pourbaix diagram) showing iron species distribution as a function of redox potential (pE) and pH.
2-line ferrihydrite is the least crystalline type of ferrihydrite, which includes two broad peaks in X-ray diffractograms. While the diagram shows ferrihydrite is thermodynamically stable across a wide pH range, kinetic factors favor its formation at circumneutral pH (6–8) in both natural environments and laboratory synthesis. Constructed using the Geochemist’s Workbench software package and the Thermo.com.v8.r6+ database available with the software. The database was updated to include the thermodynamic parameters (solubility constants as a function of temperature) for ferrihydrite (2-line) and ferrihydrite (6-line). The activity of iron in the liquid phase was set at 10−3, the CO2 partial pressure at 1 bar and the temperature at 0 °C.

References

    1. Bishop, J. L. Chapter 3 - Remote Detection of Phyllosilicates on Mars and Implications for Climate and Habitability. in (eds. Cabrol, N. A. & Grin, E. A. B. T.-F. H. to L. on M.) 37–75 (Elsevier, 2018). 10.1016/B978-0-12-809935-3.00003-7.
    1. Schwertmann, U. & Murad, E. Effect of pH on the Formation of Goethite and Hematite from Ferrihydrite. Clays Clay Min.31, 277–284 (1983).
    1. Cornell, R. M. & Schwertmann, U. The Iron Oxides: Structure, Properties, Reactions, Occurrences and Uses (Wiley, 2003). 10.1002/3527602097.
    1. Jambor, J. L. & Dutrizac, J. E. Occurrence and Constitution of Natural and Synthetic Ferrihydrite, a Widespread Iron Oxyhydroxide. Chem. Rev.98, 2549–2586 (1998). - PubMed
    1. Sagan, C., Phaneuf, J. P. & Ihnat, M. Total Reflection Spectrophotometry and Thermogravimetric Analysis of Simulated Martian Surface Materials. Icarus4, 43–61 (1965).