. 2025 Feb 25;15(1):6716.
doi: 10.1038/s41598-025-91038-4.

Establishment of an alternative splicing prognostic risk model and identification of FN1 as a potential biomarker in glioblastoma multiforme

Affiliations

Establishment of an alternative splicing prognostic risk model and identification of FN1 as a potential biomarker in glioblastoma multiforme

Xi Liu et al. Sci Rep. .

Abstract

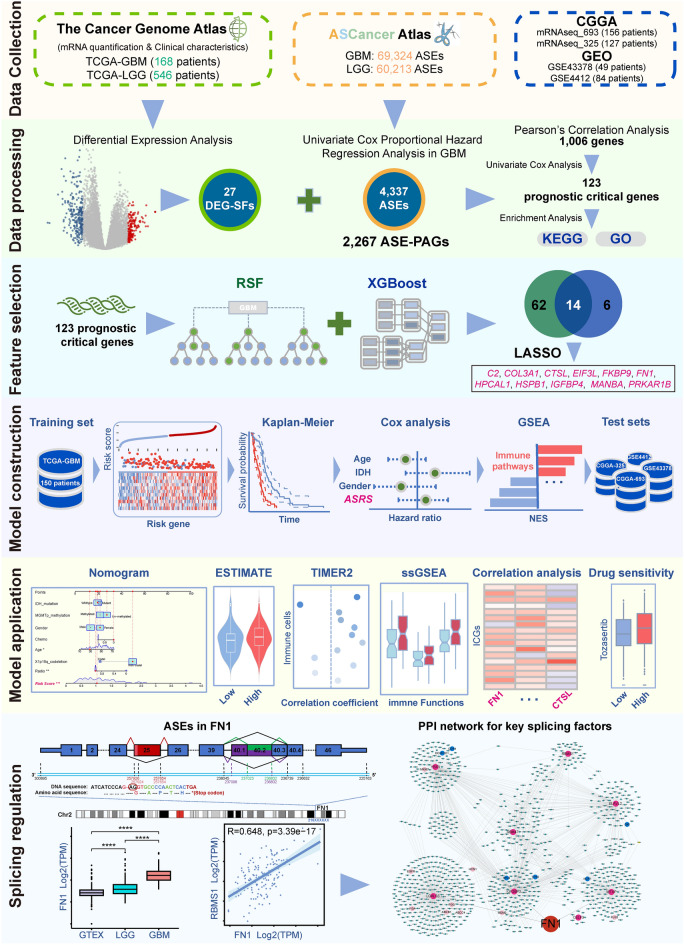
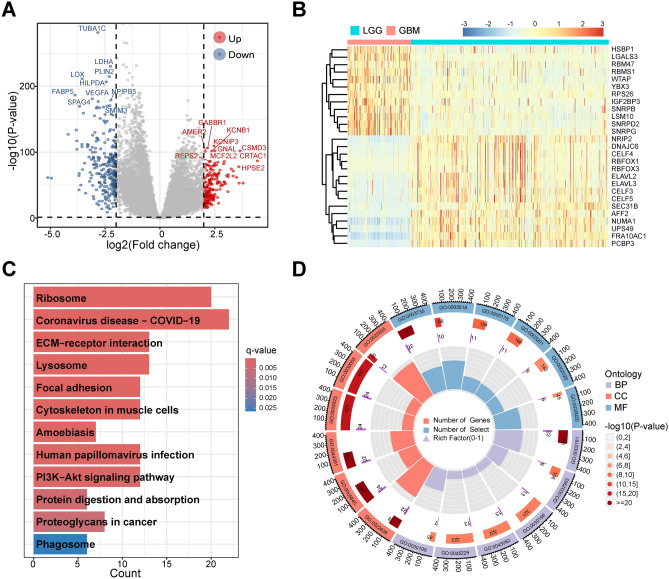
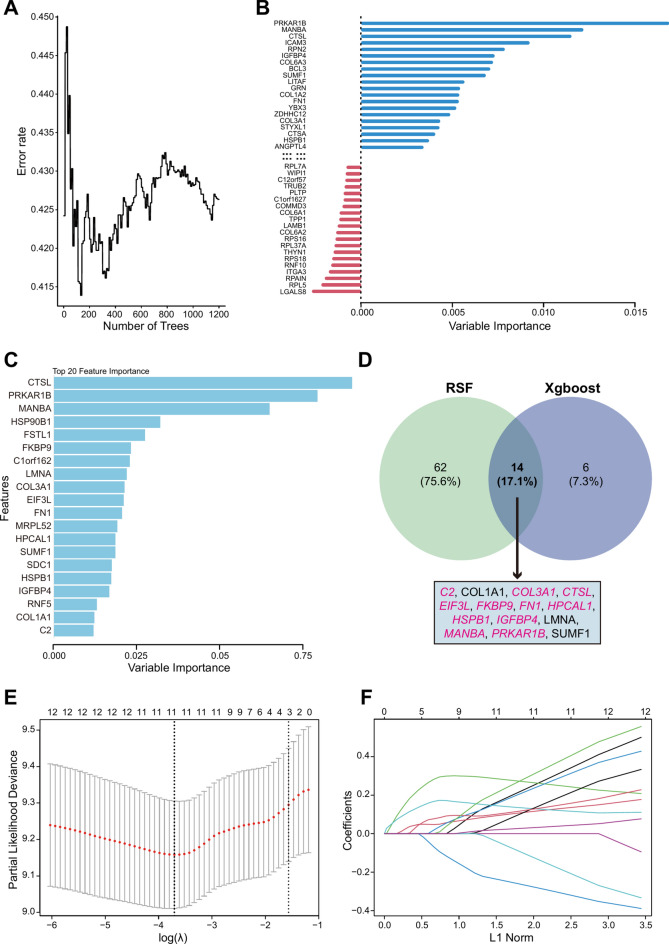
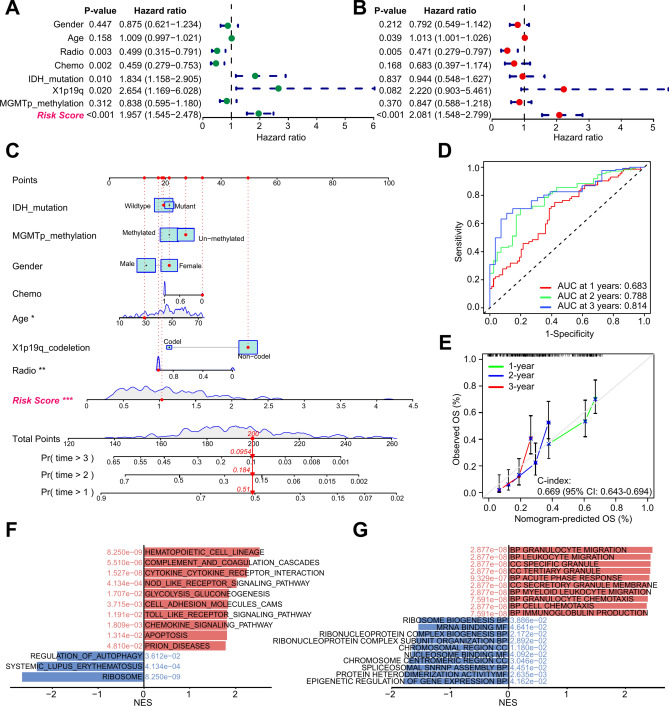
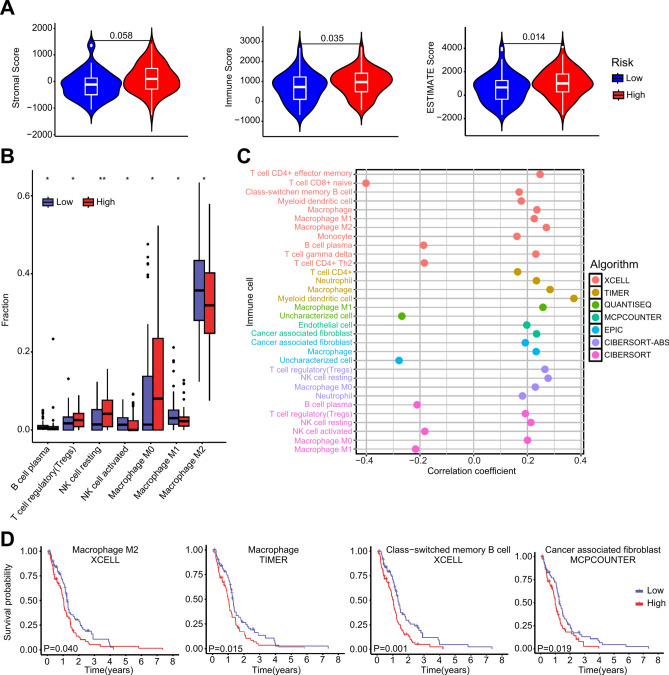
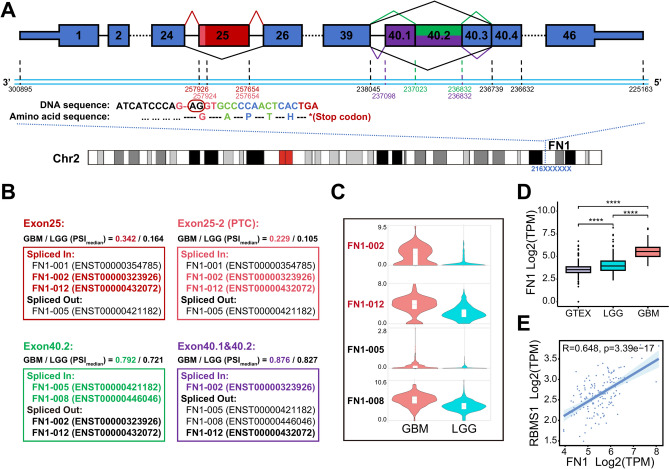
Aberrant alternative splicing and abnormal alternative splicing events (ASEs) in glioblastoma multiforme (GBM) remain largely elusive. The prognostic-associated ASEs in GBM were identified and summarized into 123 genes using GBM and LGG datasets from ASCancer Atlas and TCGA. The eleven genes (C2, COL3A1, CTSL, EIF3L, FKBP9, FN1, HPCAL1, HSPB1, IGFBP4, MANBA, PRKAR1B) were screened to develop an alternative splicing prognostic risk score (ASRS) model through machine learning algorithms. The model was trained on the TCGA-GBM cohort and validated with four external datasets from CGGA and GEO, achieving AUC values of 0.808, 0.814, 0.763, 0.859, and 0.836 for 3-year survival rates, respectively. ASRS could be an independent prognostic factor for GBM patients (HR > 1.8 across three datasets) through multivariate Cox regression analysis. The high-risk group demonstrated poorer prognosis, elevated immune scores, increased levels of immune cell infiltration, and greater differences in drug sensitivity. We found that FN1, used for model construction, contained 4 abnormal ASEs resulting in high expression of non-canonical transcripts and the presence of premature termination codon. These abnormal ASEs may be regulated by tumour-related splicing factors according to the PPI network. Furthermore, both mRNA and protein levels of FN1 were highly expressed in GBM compared to LGG, correlating with poor prognosis in GBM. In conclusion, our findings highlight the role of ASEs in affecting the progression of GBM, and the model showed a potential application for prognostic risk of patients. FN1 may serve as a promising splicing biomarker for GBM, and mechanisms of processes of aberrant splicing need to be revealed in the future.

Keywords: FN1; ASRS prognostic model; Alternative splicing; Glioblastoma.


Conflict of interest statement

Declarations. Competing interests: The authors declare no competing interests. Ethical approval: Not applicable. Consent to publish: Not applicable.

Figures

Fig. 1
Fig. 1
Workflow of this study.
Fig. 2
Fig. 2
Identification of DEG-SF in GBM and enrichment analysis of 123 prognostic related genes potentially regulated by DEG-SF. A The differentially expressed genes showed by volcano plot between TCGA-GBM and TCGA-LGG. The top 10 up- and down-regulated genes were labeled gene symbols. B Hierarchical clustering analysis of 27 DEG-SFs in the TCGA-GBM and TCGA-LGG combined gene expression data. C KEGG enrichment analysis of 123 genes with prognostic value and related to DEG-SF regulation. D GO enrichment analysis of 123 genes with prognostic value and related to DEG-SF regulation. DEG-SFs means differentially expressed splicing factors.
Fig. 3
Fig. 3
Screening of splicing-associated prognostic genes. A-B Random survival forest (RSF) error rate versus the number of classification trees and the relative importance of 76 genes with importance score more than 0 (Top 40 genes with absolute importance score > 0 are shown). C Top 20 important genes in XGBoost screening. D Venn diagram showed 14 genes screened by both RSF and XGBoost. E the cross-validation result of LASSO, and the dotted line on the left indicated the value of the harmonic parameter log(λ) when the error of the model is minimized. Eleven genes were selected. F The LASSO coefficient profiles of the 14 genes.
Fig. 4
Fig. 4
Construction and validation of the ASRS model. A Risk score distribution in the high-risk and low-risk groups of the TCGA-GBM training set, and four external test sets (CGGA-693, CGGA-325, GSE43378 and GSE4412 cohorts). B Heatmap of the expression of 11 model genes in the high-risk and low-risk groups of all cohorts. C Kaplan‒Meier curves of overall survival for all cohorts. Blue color means low-risk score, red color high-risk score. D Time-dependent ROC curves of all cohorts.
Fig. 5
Fig. 5
ASRS-based nomogram construction and biological functions analysis in the CGGA-693 cohort. A The results of univariate Cox regression analysis of clinical characteristics and ASRS. B The results of multivariate Cox regression analysis of clinical characteristics and ASRS. C Nomogram based on ASRS and clinical characteristics. "*" means P-value < 0.05, "**" P-value < 0.01, and "***" P-value < 0.001. D ROC curve analysis results. E Calibration curve analysis results. F Enrichment KEGG pathways of the high-risk and low-risk groups by GSEA analysis. G Enrichment GO terms of the high-risk and low-risk groups by GSEA analysis.
Fig. 6
Fig. 6
ASRS-based analysis of the tumour immune microenvironment. A ESTIMATE analysis for calculating stromal score, immune score, and overall ESTIMATE score in the high-risk and low-risk groups in the TCGA-GBM cohort. B Significant immune cell infiltration by CIBERSORT analysis in the high-risk and the low-risk groups. "*" means P-value < 0.05, and "**" P-value < 0.01. C The correlation analysis between ASRS and immune cell fraction calculated by 6 algorithms wrapped in TIMER2. D Kaplan‒Meier curves of overall survival for Macrophage M2 cell, Macrophage cell, Class-switched memory B cell and Cancer associated fibroblast cell infiltration in the TCGA-GBM cohort.
Fig. 7
Fig. 7
Exploration of significant alternative splicing events in FN1. A Transcript structure visualization for 4 abnormal ASEs of exon skipping in FN1. B PSI median values and the case of affected FN1 transcripts in the GBM and LGG of the four ASEs. C The expression analysis of four FN1 transcripts potentially altered through ASEs in the TCGA-GBM and TCGA-LGG datasets by GEPIA2. D Expression level of FN1 in GTEx, TCGA-LGG, and TCGA-GBM cohorts. "****" means P-value < 0.0001. E Correlation analysis between FN1 and DEG-SF, and the expression level of RBMS1 is positive correlated with FN1 and has the most highest Pearson's correlation coefficient value 0.648. ASE means alternative splicing event. DEG-SFs means differentially expressed splicing factors.

Similar articles

References

    1. Miller, K. D. et al. Brain and other central nervous system tumor statistics, 2021. CA Cancer J. Clin.71, 381–406 (2021). - PubMed
    1. Ostrom, Q. T. et al. CBTRUS statistical report: Primary brain and other central nervous system tumors diagnosed in the United States in 2016–2020. Neuro Oncol.25, iv1–iv99 (2023). - PMC - PubMed
    1. Ostrom, Q. T. et al. CBTRUS statistical report: Primary brain and other central nervous system tumors diagnosed in the United States in 2015–2019. Neuro Oncol.24, v1–v95 (2022). - PMC - PubMed
    1. Yang, P. et al. Management and survival rates in patients with glioma in China (2004–2010): A retrospective study from a single-institution. J. Neurooncol.113, 259–266 (2013). - PubMed
    1. Jiang, N. et al. Fatty acid oxidation fuels glioblastoma radioresistance with CD47-mediated immune evasion. Nat. Commun.13, 1511 (2022). - PMC - PubMed