. 2025 Feb 25;15(1):6773.
doi: 10.1038/s41598-025-90357-w.

Mathematical modeling and optimal control of depression dynamics influenced by saboteurs

Affiliations

Mathematical modeling and optimal control of depression dynamics influenced by saboteurs

S Nivetha et al. Sci Rep. .

Abstract

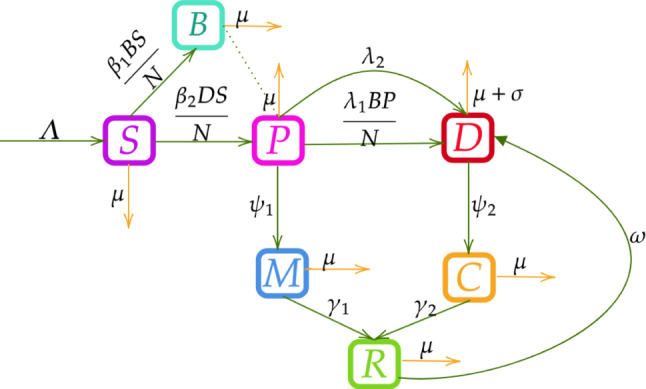
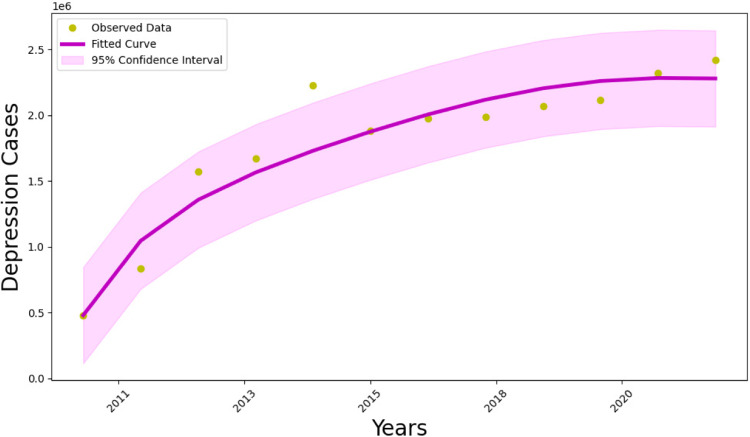
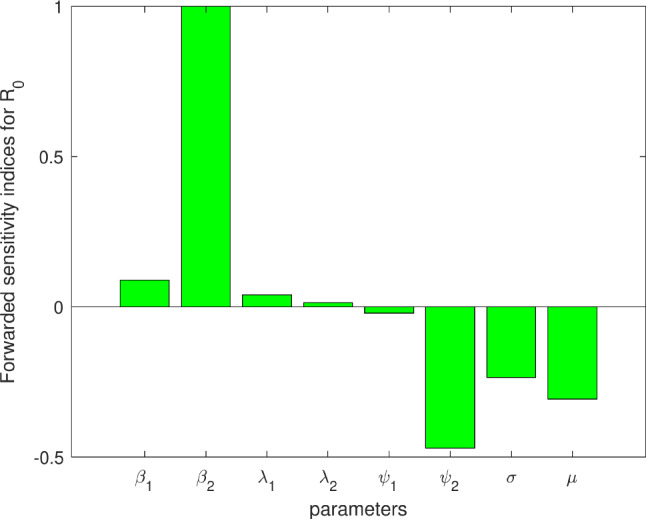
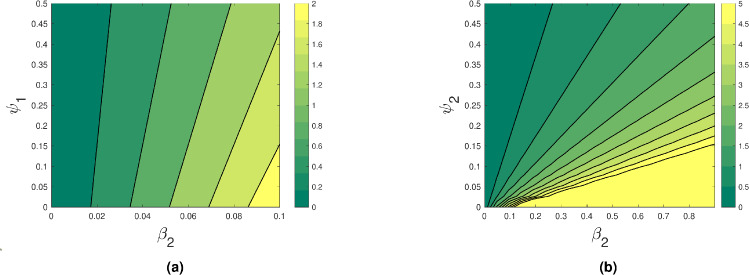
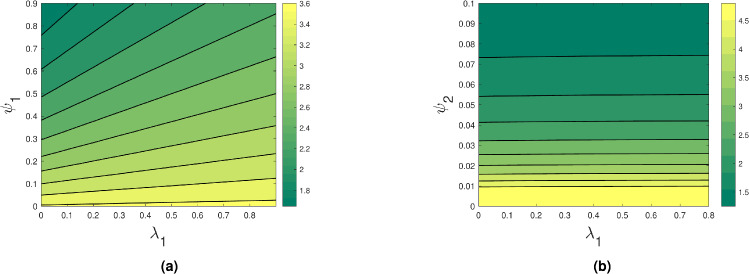
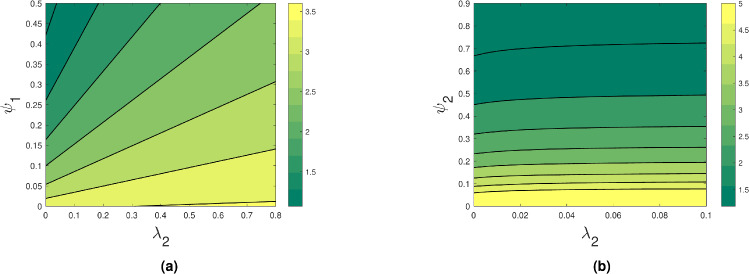
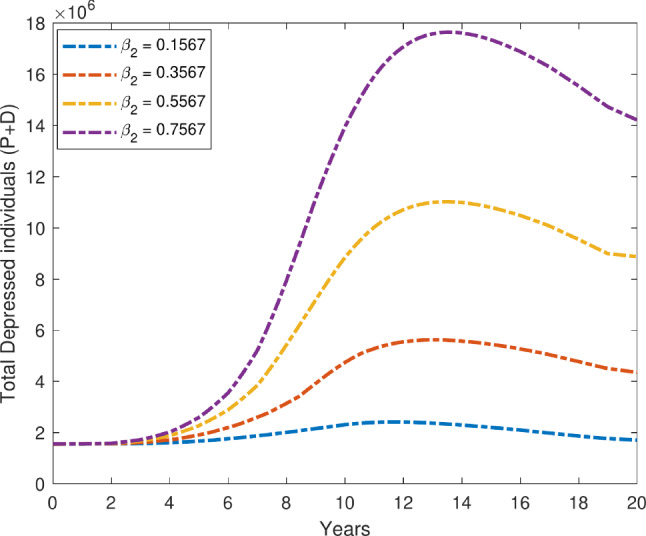
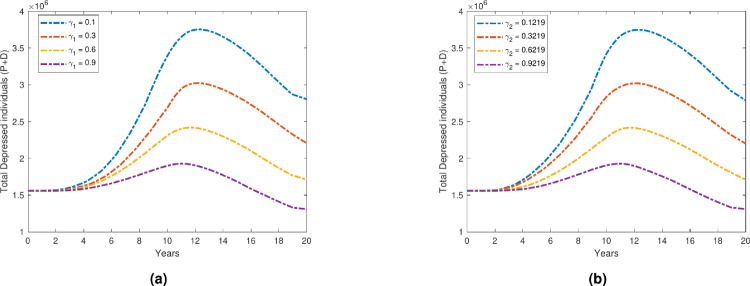
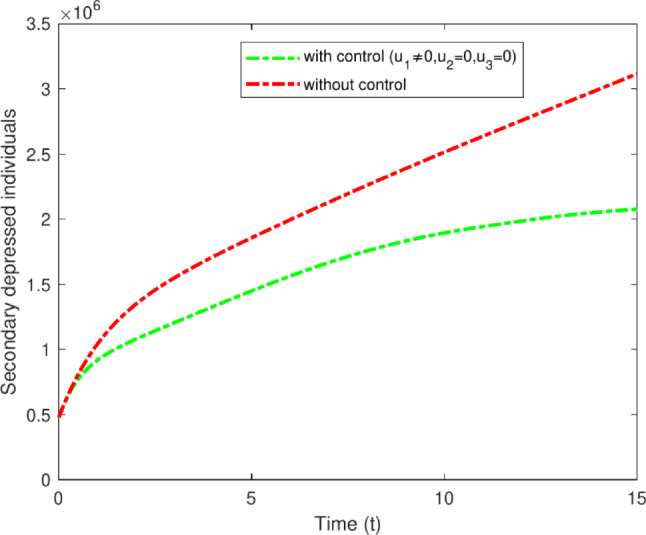
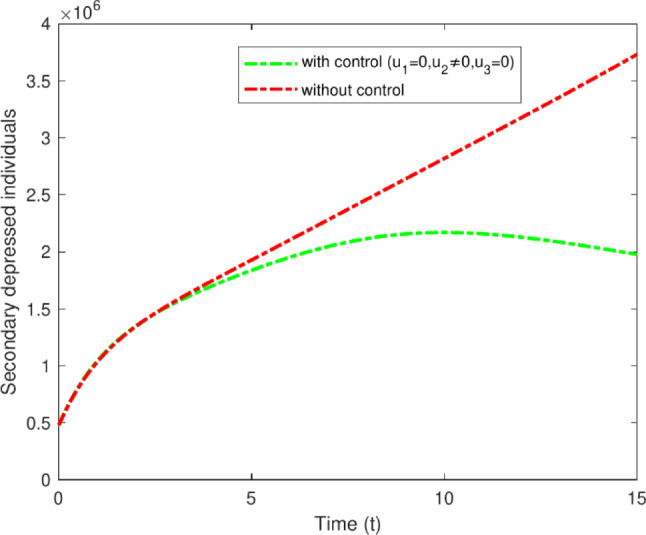
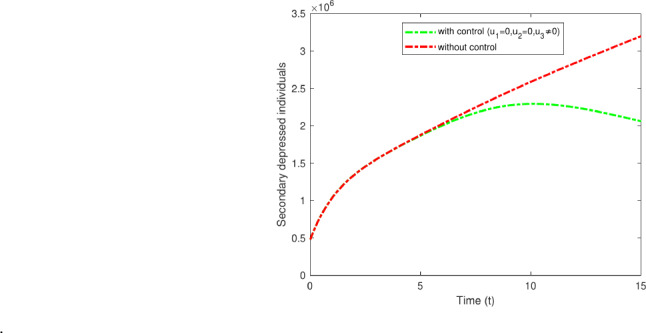
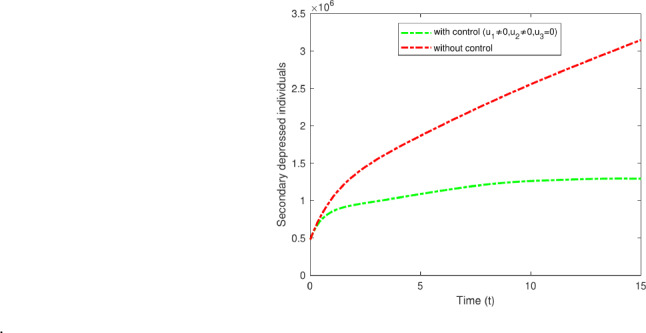
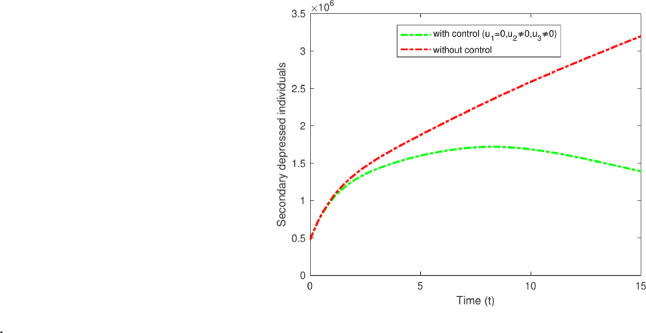
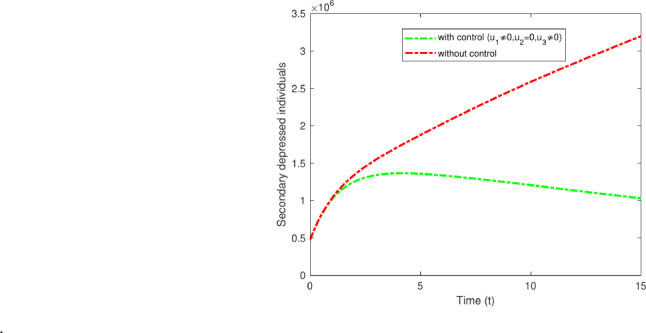
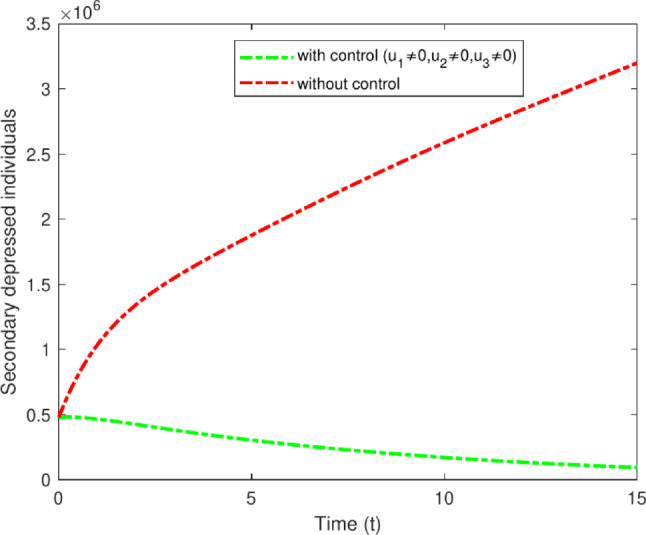
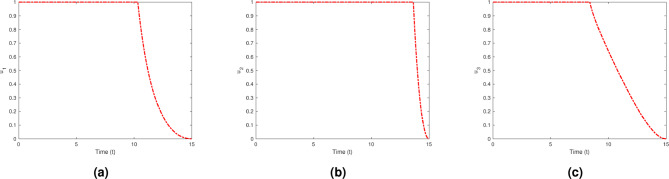
Depression disorder affects millions globally, characterized by symptoms such as profound sadness, loss of interest in activities, and disruptions in eating and sleeping patterns. Understanding depression within the context of chronic pain is essential for developing effective management and intervention strategies. This study utilizes mathematical modeling to analyze depression trends using empirical data from Spain spanning from 2011 to 2022. Our depression model incorporates distinct compartments for primary and secondary depressed populations, along with a category for individuals categorized as saboteurs, who may actively influence the depression prevalence. We calculated the basic reproduction number [Formula: see text] and identified four equilibrium points and evaluated their stability. Additionally, sensitivity analysis was conducted to assess the impact of [Formula: see text] on depression prevalence. Furthermore, optimal control strategies were explored for the model. These strategies aim to improve treatment adherence, encourage doctor consultations, promote self-medication practices, and enhance recovery rates, ultimately aiming to reduce spread of depressive disorders and associated mortality. Data fitting was conducted using Python, and simulations were carried out in MATLAB to ensure rigorous validation of the model.


Conflict of interest statement

Declarations. Competing interest: The authors declare no competing interests.

Figures

Fig. 1
Fig. 1
Flow diagram for depression model.
Fig. 2
Fig. 2
Graphs showing the model’s fit with real depression disorder cases in Spain. The yellow dots show the actual data, and the magenta line shows the model’s solution.
Fig. 3
Fig. 3
Normalized forward sensitivity index of the basic reproduction number of the depression model. The parameter values are as in Table 2.
Fig. 4
Fig. 4
Contour plots showing the effect of (a) formula image and formula image and (b) formula image and formula image on the basic reproduction number.
Fig. 5
Fig. 5
Contour plots showing the effect of (a) formula image and formula image and (b) formula image and formula image on the basic reproduction number.
Fig. 6
Fig. 6
Contour plots showing the effect of (a) formula image and formula image and (b) formula image and formula image on the basic reproduction number.
Fig. 7
Fig. 7
Variation in total depressed individuals with respect to formula image.
Fig. 8
Fig. 8
Variation in Total depressed individuals with respect to (a)formula image; (b) formula image.
Fig. 9
Fig. 9
Variation in Recovered individuals with respect to (a)formula image; (b) formula image.
Fig. 10
Fig. 10
Variation in total depressed individuals with respect to (a)formula image; (b) formula image.
Fig. 11
Fig. 11
Variation in recovered individuals with respect to (a) formula image; (b) formula image.
Fig. 12
Fig. 12
With and without interaction of Saboteurs.
Fig. 13
Fig. 13
Variations of secondary depressed individuals with and without control for formula image only.
Fig. 14
Fig. 14
Variations of secondary depressed individuals with and without optimal control for formula image only.
Fig. 15
Fig. 15
Variations of secondary depressed individuals with and without optimal control for formula image only.
Fig. 16
Fig. 16
Variations of secondary depressed individuals, with and without optimal control for formula image and formula image.
Fig. 17
Fig. 17
Variations of secondary depressed individuals with and without optimal control for formula image and formula image.
Fig. 18
Fig. 18
Variations of secondary depressed individuals with and without optimal control for all formula image and formula image.
Fig. 19
Fig. 19
Variations of Secondary depressed individuals with and without optimal control for formula image, formula image and formula image.
Fig. 20
Fig. 20
Control profile of (a) formula image, (b) formula image and (c) formula image.

Similar articles

References

    1. Sapolsky, R. Taming stress. Sci. Am.289, 86–95 (2003) (Accessed: 2024-06-08.). - PubMed
    1. Hammen, C. L. Stress and depression. Annu. Rev. Clin. Psychol.1, 293–319 (2005). - PubMed
    1. Sheidow, A. J., Henry, D. B., Tolan, P. H. & Strachan, M. K. The role of stress exposure and family functioning in internalizing outcomes of urban families. J. Child Family Stud.23, 1351–1365 (2014). - PMC - PubMed
    1. Stack, R. J. & Meredith, A. The impact of financial hardship on single parents: An exploration of the journey from social distress to seeking help. J. Family Econ. Issues39, 233–242 (2017). - PMC - PubMed
    1. Davies, W., Montgomerie, J. & Wallin, S. (Mental health and indebtedness, Financial melancholia, 2015).

LinkOut - more resources