. 2025 Apr;28(4):737-747.
doi: 10.1038/s41593-025-01889-3. Epub 2025 Feb 25.

Neuronal polyunsaturated fatty acids are protective in ALS/FTD

Affiliations

Neuronal polyunsaturated fatty acids are protective in ALS/FTD

Ashling Giblin et al. Nat Neurosci. 2025 Apr.

Erratum in

  • Author Correction: Neuronal polyunsaturated fatty acids are protective in ALS/FTD.
    Giblin A, Cammack AJ, Blomberg N, Anoar S, Mikheenko A, Carcolé M, Atilano ML, Hull A, Shen D, Wei X, Coneys R, Zhou L, Mohammed Y, Olivier-Jimenez D, Wang LY, Kinghorn KJ, Niccoli T, Coyne AN, van der Kant R, Lashley T, Giera M, Partridge L, Isaacs AM. Giblin A, et al. Nat Neurosci. 2025 Apr;28(4):913. doi: 10.1038/s41593-025-01926-1. Nat Neurosci. 2025. PMID: 40055545 Free PMC article. No abstract available.

Abstract

Here we report a conserved transcriptomic signature of reduced fatty acid and lipid metabolism gene expression in a Drosophila model of C9orf72 repeat expansion, the most common genetic cause of amyotrophic lateral sclerosis and frontotemporal dementia (ALS/FTD), and in human postmortem ALS spinal cord. We performed lipidomics on C9 ALS/FTD Drosophila, induced pluripotent stem (iPS) cell neurons and postmortem FTD brain tissue. This revealed a common and specific reduction in phospholipid species containing polyunsaturated fatty acids (PUFAs). Feeding C9 ALS/FTD flies PUFAs yielded a modest increase in survival. However, increasing PUFA levels specifically in neurons of C9 ALS/FTD flies, by overexpressing fatty acid desaturase enzymes, led to a substantial extension of lifespan. Neuronal overexpression of fatty acid desaturases also suppressed stressor-induced neuronal death in iPS cell neurons of patients with both C9 and TDP-43 ALS/FTD. These data implicate neuronal fatty acid saturation in the pathogenesis of ALS/FTD and suggest that interventions to increase neuronal PUFA levels may be beneficial.


Conflict of interest statement

Competing interests: The authors declare no competing interests.

Figures

Fig. 1
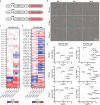
Fig. 1. Transcriptomic and lipidomic analyses reveal downregulation of fatty acid and lipid metabolism genes and loss of PUFA-containing phospholipids in C9 flies.
a, C9 flies were induced for 5 d before performing RNA-seq on heads compared with age-matched uninduced controls. b, GO biological process enrichment analyses showing lipid metabolism terms significantly enriched among downregulated genes in RNA-seq comparison of C9-induced fly heads versus uninduced controls (n = 4 biological replicates, with 15 fly heads per replicate). Genotype: UAS-(G4C2)36; elavGS. c, Volcano plot highlighting significantly downregulated fatty acid synthesis and desaturation genes in C9 fly heads. AcCoAS, Acetyl-coenzyme A synthetase. DEGs in b and c were calculated with DEseq2 using default parameters (Methods). d, Simplified long-chain fatty acid synthesis and desaturation pathway, with Drosophila genes in boxes and human orthologous genes in parentheses underneath. The blue boxes indicate genes that were significantly downregulated in C9 fly heads. The ‘C’ number indicates the number of carbons in the fatty acyl chain, the number after the colon denotes the number of double bonds and the ‘ω’ number denotes the position of the final double bond before the methyl carbon. e, C9 and wild-type (elavGS driver alone) flies induced for 7 d before brains were dissected for lipidomics analyses. f, Heatmap displaying all detected phospholipids as log2(fold-change) (log2(FC)) over wild-type fly brains (n = 3 biological replicates, with 20 fly brains per replicate). g, Volcano plots of all detected phospholipid species in C9 fly brains compared with wild-type control flies showing log2(fold-change) over wild-type and significance (two-sided Student’s t-test). Top, color corresponding to the number of double bonds in the phospholipid species’ most unsaturated fatty acyl chain. Bottom, all PUFA-containing species (two or more double bonds) colored cyan. Genotypes: elavGS, UAS-(G4C2)36; elavGS. Source data
Fig. 2
Fig. 2. C9 repeats cause loss of highly unsaturated phospholipid species in iPS-cell-derived neurons.
a, C9 and isogenic control i3iPS cells were induced using the i3Neuron protocol, and cultured for 21 d in vitro (DIV21) for lipidomic analyses. To confirm disease specificity of lipid changes, control (Con.) lines were transduced with (G4C2)92 repeat or (G4C2)2 control lentiviruses, and C9 lines were treated with a C9orf72 ASO or an NT control ASO. Tech. rep., Technical replicate. b, Heatmap displaying all detected phospholipids as log2(fold-change) over controls for each experimental condition (n = 3 C9 lines, n = 2 control lines + lentiviruses, n = 3 C9 lines + ASO). Highly unsaturated species (four or more double bonds, outlined) were reduced in C9 lines and after lentivirus-(G4C2)92 treatment but increased in C9 lines treated with the C9 ASO compared with C9 lines treated with the NT ASO, indicating that these changes were driven by C9 repeats. The gray boxes indicate phospholipid species that were outside the fold-change range. c, Volcano plots of all detected phospholipid species in each line or condition compared with its control, displaying downregulation of highly unsaturated species (four or more double bonds). Values represent log2(fold-change) over control and significance (two-sided Student’s t-test) across all replicates within the labeled group. Top, color corresponding to the number of double bonds in the phospholipid species’ most unsaturated fatty acyl chain. Bottom, the highly unsaturated species (four or more double bonds) highlighted in blue. Source data
Fig. 3
Fig. 3. Highly unsaturated phospholipids are decreased in FTLD postmortem frontal cortex.
a, Lipidomics performed on postmortem tissues from FTLD and age- and sex-matched control frontal cortex and cerebellum samples. b, Heatmap displaying all detected phospholipids as log2(fold-change) over control in each brain region. Highly unsaturated species (four or more double bonds, except those containing C20:4) are outlined in cyan and show broad downregulation in FTLD frontal cortex but not cerebellum. Species containing arachidonic acid (C20:4) are outlined in red and many display upregulation in FTLD frontal cortex. Species containing linoleic acid (C18:2) are outlined in blue and show downregulation in both tissue regions. Cbl, cerebellum; F. Ctx, frontal cortex. c, Unsaturation indices of phospholipids from FTLD and control brain regions, demonstrating a significant reduction in frontal cortex but not in cerebellum (two-way ANOVA, main effects of brain region (P < 0.0001) and disease state (P = 0.0154); post-hoc comparisons of FTLD versus control P values adjusted with Šídák’s multiple-comparison test; n = 13 control and n = 45 FTLD frontal cortex; n = 13 control and n = 47 FTLD cerebellum samples from separate individuals). The bounds of the box represent the 25th and 75th percentiles, whereas the whiskers represent minima and maxima and the line the median. Schematic in a created using BioRender; Cammack, A. (2024) https://BioRender.com/b41l552. Source data
Fig. 4
Fig. 4. Promoting fatty acid desaturation through either genetic or feeding paradigms extends C9 fly survival and prevents cold-stress-induced death and paralysis.
a, Simplified fatty acid desaturation pathway. b,c, Dietary supplementation of linoleic (b) or α-linolenic (c) acid at 0.15 mM extended C9 fly survival (linoleic acid P = 5.687 × 10−5; α-linolenic acid P = 2.951 × 10−6, log-rank test; n = 152 (0 mM), n = 134 (0.15 mM C18:2), n = 141 (0.15 mM C18:3)). d, Neuronal overexpression of FAT-2 extended C9 fly survival (P = 5.119 × 10−38), log-rank test, n = 147 ((G4C2)36), n = 146 ((G4C2)36) + FAT-2. e, Volcano plot showing neuronal expression of FAT-2 resulting in conversion of C18:1 into C18:2 and C18:3 within C9 fly brain phospholipids (n = 3 biological replicates, with 20 fly brains per replicate). Values represent log2(fold-change) over control and significance (two-sided Student’s t-test) across all replicates within the labeled group. f, Schematic diagram of cold stress assay. g, C9 flies show sensitivity to cold stress, with significantly increased death and paralysis, and decreased recovery compared with uninduced controls (P < 0.0001). Neuron-specific overexpression of Desat1 or FAT-2 in C9 flies significantly increased the proportion of flies experiencing a full recovery compared with (G4C2)36 alone and significantly reduced death post-exposure compared with (G4C2)36 alone (n = 3 biological replicates, containing 15 flies per replicate). Results were analyzed by χ2 test. Data are presented as mean ± s.d. Genotypes: UAS-(G4C2)36; elavGS, UAS-(G4C2)36; elavGS/UAS-Desat1, UAS-(G4C2)36; elavGS/UAS-FAT-2. Schematic in f created using BioRender; Isaacs, A. (2025) https://BioRender.com/v04i884. Source data
Fig. 5
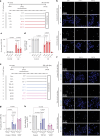
Fig. 5. FAT-1 and FAT-2 rescue glutamate-induced excitotoxicity in C9 and TDP-43 iPS cell-SNs.
a, Schematic of SN differentiation timeline, with timepoints of nucleofection and glutamate-induced excitotoxicity measurements. tox., toxicity. b, Representative confocal images of cell death in control and C9orf72 iPS cell-SNs expressing BFP, FAT-1 or FAT-2, as measured by PI incorporation. c,d, Quantification of the ratio of PI-positive (c) spots to DAPI-positive (d) nuclei (quantification of cell death) and Alamar Blue cell viability assay after 4-h exposure to 10 µM glutamate (n = 6 lines per condition). norm., normalized. e, Schematic of glutamate-induced excitotoxicity assay in TDP-43 and SOD1 mutant lines. f, Representative confocal images of PI incorporation in control, TDP-43 and SOD1 iPS cell-SNs (n = 3 lines per condition). g,h, Quantification of PI incorporation (g) and Alamar Blue cell viability assays (h) after 4-h exposure to 10 µM glutamate. Datapoints for PI incorporation represent average percentage cell death across ten images per well. Datapoints for Alamar Blue assay represent average percentage viability from three replicate wells for each condition. Two-way ANOVA with Tukey’s multiple-comparison test was used to calculate statistical significance in c, d, g and h. Data are presented as mean ± s.d. throughout the figure. Source data
Extended Data Fig. 1
Extended Data Fig. 1. Fatty acid synthesis and desaturation pathway genes are downregulated in C9 ALS post-mortem cervical spinal cord and C9 Drosophila.
(a) GO enrichment of upregulated genes in RNA-seq comparison of C9 fly heads versus controls. Differentially expressed genes were calculated with DEseq2 using default parameters (see Methods). Genotype: UAS-(G4C2)36; elavGS (b) Confirmation of C9 Drosophila RNA-seq result by RT-qPCR, showing significant downregulation of AcCoAS, FASN1 and Desat1 in C9 Drosophila heads versus controls, normalised to tubulin (n = 4 biological replicates, with 15 fly heads per replicate). Two-sided, unpaired Students t-test, data presented as mean ± s.d. (c) Volcano plots of RNA-seq data from patient post-mortem cervical spinal cord comparing either all ALS (left; n = 138) or just the C9 ALS subset (right; n = 28) with non-neurological disease controls (n = 36) from the New York Genome Center ALS Consortium highlighting conserved downregulation of canonical fatty acid synthesis and desaturation pathway genes. These data are publicly available at https://rstudio-connect.hpc.mssm.edu/als_spinal_cord_browser/ and all DEGs have also been included in Excel format with this manuscript as Supplementary Data File 1. Source data
Extended Data Fig. 2
Extended Data Fig. 2. Lipidomic analyses in RNA-only (RO) and GR36 fly brains.
(a) Heatmap displaying all detected phospholipids as log2(fold-change) over control fly brains (n = 3 biological replicates per condition with 15 fly brains per replicate). Lipids were normalized by lipid class. (b, c) Volcano plots of all detected phospholipid species in RO (b) or GR36 (c) fly brains compared to wild-type control flies. Values represent log2(fold-change) over control and significance (two-sided Student’s t-test) across all replicates within the labeled group. In top plot, color corresponds to the number of double bonds in the phospholipid species’ most unsaturated fatty acyl chain. In bottom, PUFA-containing species (≥2 double bonds) are highlighted in blue. Genotypes: elavGS, UAS-(G4C2)36 RO; elavGS, UAS-(GR)36; elavGS. Source data
Extended Data Fig. 3
Extended Data Fig. 3. Phospholipid levels in i3Neurons, displayed as separate neuronal inductions/lines.
(a) Heatmap displaying all detected phospholipids as log2(fold-change) over control in each neuronal induction separately. Lipids are normalized by lipid class. Grey boxes indicate phospholipid species that are outside the fold-change range or were not detected in that induction. Loss of highly unsaturated species is consistently observed across neuronal inductions in C9 lines and control lines expressing 92-repeats, while phenotype is prevented by C9-ASO treatment. (b, c) Volcano plots of all detected phospholipid species in C9 lines 1 (b) and 3 (c) compared to their individual isogenic control lines, displaying downregulation of highly unsaturated species (≥4 double bonds). (d, e) Volcano plots displaying all phospholipid species in C9 lines 1 (d) and 3 (e) treated with a C9-ASO compared to a NT-ASO control. In (b-e), values represent log2(fold-change) over control and significance (two-sided Student’s t-test) across all replicates/inductions within the labeled group. In top plots, color corresponds to the number of double bonds in the phospholipid species’ most unsaturated fatty acyl chain. Source data
Extended Data Fig. 4
Extended Data Fig. 4. Poly(GA) levels in i3Neuron lines treated with (G4C2) lentiviruses or sense repeat-targeted antisense oligonucleotides (ASOs).
(a) Lentiviral 92 (Lentivirus-(G4C2)92) and 2 (Lentivirus-(G4C2)2) repeat constructs have 300 bp of endogenous repeat-flanking sequence to facilitate RAN translation and include an IRES-GFP for live-cell visualization. (b) (G4C2)92 and (G4C2)2 lentiviruses were titrated via GFP signal (live imaged) to high transduction efficiencies for lipidomic experiments. (c-e) poly(GA) immunoassay in (c) C9 lines (n = 1–3 inductions per line), (d) control lines treated with (G4C2)92 or (G4C2)2 (n = 3 inductions per line), and (e) C9 lines treated with sense repeat-targeted (C9) ASOs or non-targeted (NT) control ASOs from (n = 2–4 inductions per line). All measurements were taken on DIV21 from the same neuronal inductions used for lipidomic analyses. Each dot is an independent induction. Error bars show ± s.d. Source data
Extended Data Fig. 5
Extended Data Fig. 5. Lipid class distributions and lipid gene qPCRs in i3Neurons.
(a) Lipid classes displayed as proportion of total lipidome in i3Neurons. Data points represent average lipid class level for each separate i3Neuron line (biological replicate), averaged across inductions (n = 2 control lines; n = 3 C9 lines; n = 3 C9 lines + NT-ASO; n = 3 C9 lines + C9-ASO). For lentiviral experiments, biological replicates were considered separate inductions, and the single datapoints in this figure represent the average of n = 3 inductions per virus. CE = cholesterol ester; Cer = ceramide; DG = diacylglyceride; FA = fatty acid; HexCER = hexosylceramide; LacCER = lactosylceramides; LPC = lysophosphatidylcholine; LPE = lysophosphatidylethanolamine; PA = phosphatidic acid; PC = phosphatidylcholine; PE = phosphatidylethanolamine; PG = phosphatidylglycerol; PI = phosphatidylinositol; PS; phosphatidylserine; SM = sphingomyelin; TG = triacylglyceride. (b) RT-qPCRs of fatty acid synthase (FASN) and neuronal desaturases, showing no significant changes in C9 compared to isogenic controls (One-way ANOVA for control line 3 and C9 lines 2 and 3; two-sided unpaired Student’s t-test for control line 1 and C9 line 1; no significant differences found). Error bars show mean ± s.d. Source data
Extended Data Fig. 6
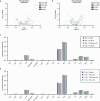
Extended Data Fig. 6. Volcano plots of phospholipid species and lipid class distributions in FTLD versus control post-mortem tissues.
(a, b) Volcano plots of all detected phospholipid species in FTLD compared to non-neurological control in cerebellum (a) and frontal cortex (b), displaying downregulation of highly unsaturated species (≥4 double bonds) in the frontal cortex. Values represent log2(fold-change) over control and significance (two-sided Student’s t-test). (c, d) Lipid classes displayed as proportion of total lipidome in control and FTLD post-mortem cerebellum (c) and frontal cortex (d). Bars represent average across all samples (n = 45–47 FTLD, n = 13 control). CE = cholesterol ester; Cer = ceramide; DG = diacylglyceride; FA = fatty acid; HexCER = hexosylceramide; LacCER = lactosylceramides; LPC = lysophosphatidylcholine; LPE = lysophosphatidylethanolamine; PA = phosphatidic acid; PC = phosphatidylcholine; PE = phosphatidylethanolamine; PG = phosphatidylglycerol; PI = phosphatidylinositol; PS; phosphatidylserine; SM = sphingomyelin; TG = triacylglyceride. Source data
Extended Data Fig. 7
Extended Data Fig. 7. Lifespans of C9 flies fed saturated, monounsaturated, and polyunsaturated long chain fatty acids.
(a) Structure and saturation of selected fatty acids. (b) Linoleic acid significantly increased survival of C9 flies at 0.15 mM (P = 0.031) and 1.5 mM (P = 0.001) concentrations, but not at 15 mM (P = 0.699). n = 148 (0 mM), n = 151 (C18:2 0.15 mM), n = 144 (C18:2 1.5 mM), n = 135 (C18:2 15 mM). Log-rank test used for all comparisons. (c) α-linolenic acid significantly increased survival of C9 flies at 0.015 mM (P = 0.048) and 0.15 mM (P = 0.044) concentrations, but not at 1.5 mM (P = 0.495). Log-rank test used for all comparisons. (d) Palmitic acid had no significant effect on survival of C9 flies at any of the concentrations tested (0.15 mM, P = 0.052, 1.5 mM P = 0.182, 15 mM P = 0.473). n = 148 (0 mM), n = 145 (C16:0 0.15 mM), n = 146 (C16:0 1.5 mM), n = 147 (C16:0 15 mM). Log-rank test used for all comparisons. (e) Stearic acid had no significant effect at 0.15 mM (P = 0.079) or 1.5 mM (P = 0.992), but significantly decreased survival at 15 mM (P = 0.008). n = 148 (0 mM), n = 146 (C18:0 0.15 mM), n = 149 (C18:0 1.5 mM), n = 150 (C18:0 15 mM). Log-rank test used for all comparisons. (f) Oleic acid had no significant effect on survival at any of the concentrations tested (0.15 mM, P = 0.285, 1.5 mM P = 0.782, 15 mM P = 0.186). n = 148 (0 mM), n = 143 (C18:1 0.15 mM), n = 142 (C18:1 1.5 mM), n = 150 (C18:1 15 mM). Log-rank test used for all comparisons. Genotype: UAS-(G4C2)36; elavGS. (g) Linoleic acid supplementation had no effect on wild-type lifespan at 0.15 mM (P = 0.162) and significantly shortened wild-type lifespan at the 1.5 mM (P = 4.352×10⁻⁵) concentration. n = 150 (0 mM), n = 151 (C18:2 0.15 mM), n = 152 (C18:2 1.5 mM). Log-rank test used for all comparisons. (h) α-linolenic acid had no effect on wild-type lifespan at 0.015 mM (P = 0.599), and significantly shortened wild-type lifespan at the 0.05 mM concentration (P = 6.22×10⁻⁶). n = 150 (0 mM), n = 150 (C18:3 0.015 mM), n = 148 (C18:3 0.15 mM). Log-rank test used for all comparisons. (i, j) Food supplementation with linoleic or α-linolenic acid does not alter proboscis extension response of wild-type (i) or C9 (j) flies. Flies were placed onto new food 24 hours before assay was performed, at a density of five flies per biological replicate vial. All groups were induced with RU486 except for the uninduced conditions. Two-way ANOVA with Tukey’s multiple comparison test was used to calculate statistical significance. Data presented as mean ± s.d. (i) n = 7 flies (18:2 1.5 mM) n = 8 flies (uninduced 0 mM, 0 mM, 18:3 0.015 mM, 18:3 0.15 mM), n = 9 flies (18:2 0.15 mM). (j) n = 7 flies (0 mM, 18:2 1.5 mM) n = 8 flies (uninduced 0 mM, 18:3 0.015 mM, 18:3 0.15 mM), n = 9 flies (18:2 0.15 mM). Genotypes: elavGS, UAS-(G4C2)36; elavGS. Source data
Extended Data Fig. 8
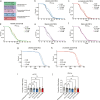
Extended Data Fig. 8. Overexpression of fatty acid synthases extends C9 survival, while fatty acid synthase and desaturase overexpression does not alter poly(GP) levels.
(a, b) Neuronal overexpression of FASN1 (a) or FASN2 (b) extended C9 fly survival (FASN1 P = 1.16×10⁻⁵; FASN2 P = 0.003), log-rank test used for each comparison. n = 151 ((G4C2)36), n = 144 ((G4C2)36 + FASN1), n = 132 (G4C2)36 + FASN2. (c) Confirmation of FASN1, FASN2 and Desat1 overexpression in (G4C2)36 fly heads after 7 days of neuronal expression (n = 4 biological replicates with 15 heads per replicate). Two-sided, unpaired Students t-test, data presented as mean ± s.d. (d) Neuronal overexpression of Desat1 extended C9 fly survival (P = 5.839×10⁻²⁰). n = 147 ((G4C2)36), n = 143 ((G4C2)36 + Desat1), log-rank test. (e) Neuronal expression of Desat1 results in conversion of C18:0 into C18:1 in phospholipids from dissected C9 fly brains. Lipids normalized by lipid class. Values represent log2(fold-change) over control and significance (two-sided Student’s t-test). (f) Neuronal expression of FASN1 (P = 0.989) or FASN2 (P = 0.992) did not alter poly(GP) levels in C9 fly heads. One-way ANOVA, followed by Tukey’s post-hoc test. n = 4 biological replicates per condition, consisting of 10 heads per replicate. Data presented as mean ± s.d. (g) Neuronal expression of Desat1 (P = 0.401) or FAT-2 (P = 0.920) did not alter poly(GP) levels in C9 fly heads. One-way ANOVA, followed by Tukey’s post-hoc test. n = 4 biological replicates per condition, consisting of 10 heads per replicate. Data presented as mean ± s.d. (h) Desat1 neuronal overexpression significantly increased the proportion of flies experiencing a full recovery compared to (G4C2)36 alone, whereas loss of one copy of Desat1 in C9 flies significantly increased death and partial paralysis after cold stress. n = 3 biological replicates, containing 15 flies per replicate vial. Results were analyzed by Chi-square test. Data presented as mean ± s.d. Note that the (G4C2)36; elavGS uninduced and induced data are the same as in Fig. 4g. Genotypes (a-h): UAS-(G4C2)36; elavGS, UAS-(G4C2)36; elavGS/UAS-Desat1, UAS-(G4C2)36; elavGS/UAS-Desat1[42]. (i) Knocking down FASN1 in neurons of (G4C2)36 flies does not significantly alter C9 fly survival (P = 0.767), n = 124 ((G4C2)36), n = 136 ((G4C2)36+ FASN RNAi), log-rank test. (j) Loss of one copy of Desat1 significantly worsens C9 fly survival (P = 0.016), n = 154 ((G4C2)36), n = 148 ((G4C2)36 + Desat1 +/−), log-rank test. (k, l) Knocking down FASN1 (P = 0.127) (k) or Desat1 (P = 0.984) (l) in wild-type eye neurons does not cause neurodegeneration. Two-sided, unpaired Students t-test, n = 25 biological replicates per genotype, data presented as mean ± s.d. Scale bars represent 0.1 mm. Genotypes (k, l): GMR-Gal4, GMR-Gal4; UAS-FASN RNAi, GMR-Gal4; UAS-Desat1 RNAi. Genotypes: GMR-Gal4, GMR-Gal4; UAS-FASN RNAi, GMR-Gal4; UAS-Desat1 RNAi. (m) Knocking down FASN1 in wild-type neurons slightly increases lifespan (P = 0.003), log-rank test, n = 133 (FASN1 RNAi induced), n = 148 FASN1 RNAi uninduced. Genotype: UAS-FASN1 RNAi; elavGS. (n) FASN1 overexpression in neurons of wild-type flies extended lifespan (P = 3.386×10⁻⁸), log-rank test, n = 156 (FASN1 induced), n = 151 (FASN1 uninduced). (o) FASN2 overexpression in neurons of wild-type flies had no effect on lifespan (P = 0.866), log-rank test, n = 156 (FASN2 induced), n = 141 (FASN2 uninduced). (p) Desat1 overexpression in neurons of wild-type flies extended lifespan (P = 1.567×10⁻¹⁰), log-rank test, n = 114 (Desat1 induced), n = 116 (Desat1 uninduced). (q) Overexpression of FAT-2 in neurons of wild-type flies had no effect on lifespan (P = 0.590), log-rank test, n = 123 (FAT-2 induced), n = 105 (FAT-2 uninduced). Genotypes (n-q): elavGS, UAS-FASN1; elavGS, UAS-FASN2; elavGS, elavGS/UAS-Desat1, elavGS/UAS-FAT-2. Source data
Extended Data Fig. 9
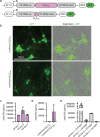
Extended Data Fig. 9. Lipidomic assessment of FAT-1 and FAT-2 overexpression in C9 i3Neurons.
(a) Schematic of lentiviral constructs used to overexpress FAT-1, FAT-2, or a BFP-only control in vitro. (b) Live-cell images of C9 i3Neuron lines overexpressing BFP, FAT-1, or FAT-2, demonstrating high efficiency transduction (as shown by expression of the 2XNLS-mApple reporter). Images representative of at least two inductions per line (n = 3 C9 line 1; n = 2 C9 line 2; n = 3 C9 line 3). (c, d) Heatmap displaying all detected (c) free fatty acids and (d) phospholipids as log2(fold-change) over BFP-only control in each C9 line, averaged across three separate neuronal inductions per line. Lipids are normalized by lipid class and sorted by number of double bonds in the most unsaturated fatty acyl chain. Grey boxes indicate lipid species that were either not detected in a condition or are outside the fold-change range. (e) Volcano plots of all detected free fatty acid species in FAT-1 or FAT-2 overexpression compared to BFP-only control. Values represent log2(fold-change) over BFP-only control and significance (two-sided Student’s t-test) across all replicates/inductions within the labeled group. Source data

References

    1. DeJesus-Hernandez, M. et al. Expanded GGGGCC hexanucleotide repeat in noncoding region of C9ORF72 causes chromosome 9p-linked FTD and ALS. Neuron72, 245–256 (2011). - PMC - PubMed
    1. Renton, A. E. et al. A hexanucleotide repeat expansion in C9ORF72 is the cause of chromosome 9p21-linked ALS-FTD. Neuron72, 257–268 (2011). - PMC - PubMed
    1. Mori, K. et al. The C9orf72 GGGGCC repeat is translated into aggregating dipeptide-repeat proteins in FTLD/ALS. Science339, 1335–1338 (2013). - PubMed
    1. Ash, P. E. A. et al. Unconventional translation of C9ORF72 GGGGCC expansion generates insoluble polypeptides specific to c9FTD/ALS. Neuron77, 639–646 (2013). - PMC - PubMed
    1. Zu, T. et al. RAN proteins and RNA foci from antisense transcripts in C9ORF72 ALS and frontotemporal dementia. Proc. Natl Acad. Sci. USA110, E4968–E4977 (2013). - PMC - PubMed

MeSH terms