

Association of phenotypic age acceleration with all-cause and cause-specific mortality among U.S. cancer survivors: a retrospective cohort study
- PMID: 40001013
- PMCID: PMC11853897
- DOI: 10.1186/s12885-025-13760-6
Association of phenotypic age acceleration with all-cause and cause-specific mortality among U.S. cancer survivors: a retrospective cohort study
Abstract
Background: Cancer survivors may experience accelerated biological aging, increasing their risk of mortality. However, the association between phenotypic age acceleration (PAA) and mortality among cancer survivors remains unclear. This study aimed to evaluate the relationship between PAA and all-cause mortality, cancer-specific mortality, and non-cancer mortality among adult cancer survivors in the United States.
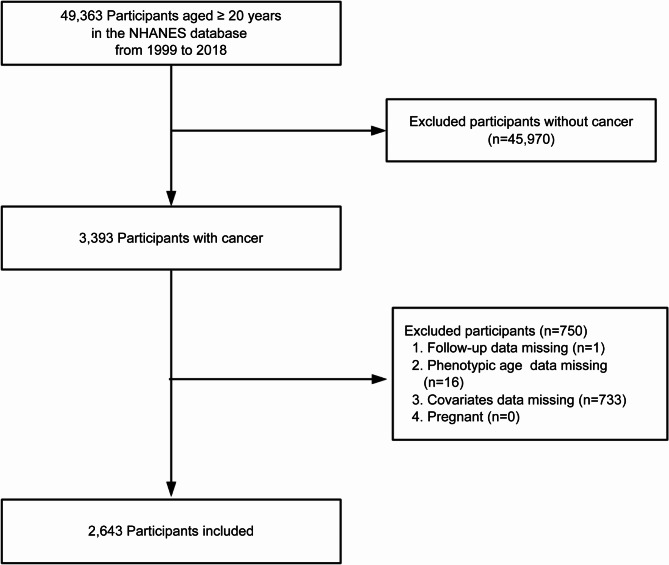
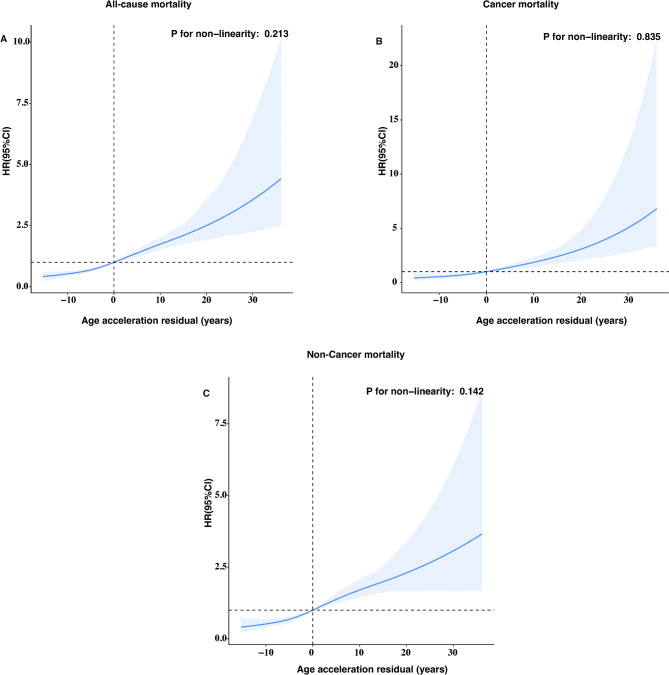
Methods: We utilized data from the National Health and Nutrition Examination Survey (NHANES) from 1999 to 2018, including 2,643 (unweighted) cancer patients aged ≥ 20 years. Phenotypic age was calculated using ten physiological biomarkers, and the residuals from regressing phenotypic age on chronological age (age acceleration residuals, AAR) were used to determine PAA status. Participants were divided into PAA and without PAA groups based on the sign of the residuals. Weighted Cox proportional hazards regression models were used to assess the association between PAA and mortality, adjusting for demographic characteristics, lifestyle factors, and comorbidities. Restricted cubic spline (RCS) models were employed to explore the dose-response relationship between AAR and mortality.
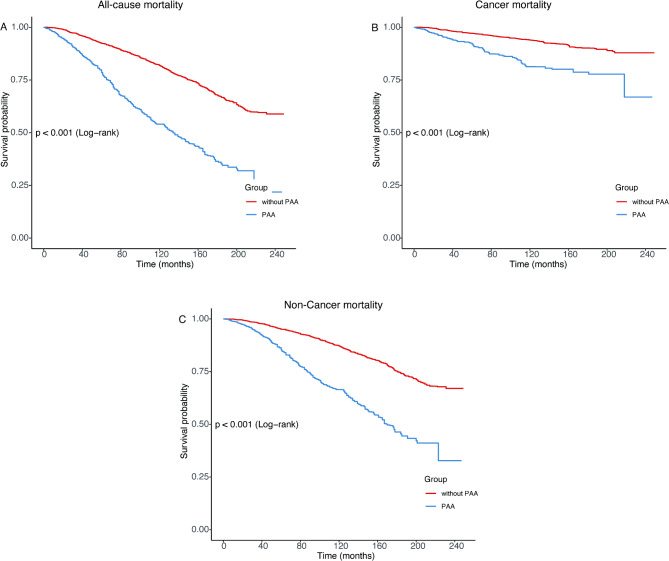
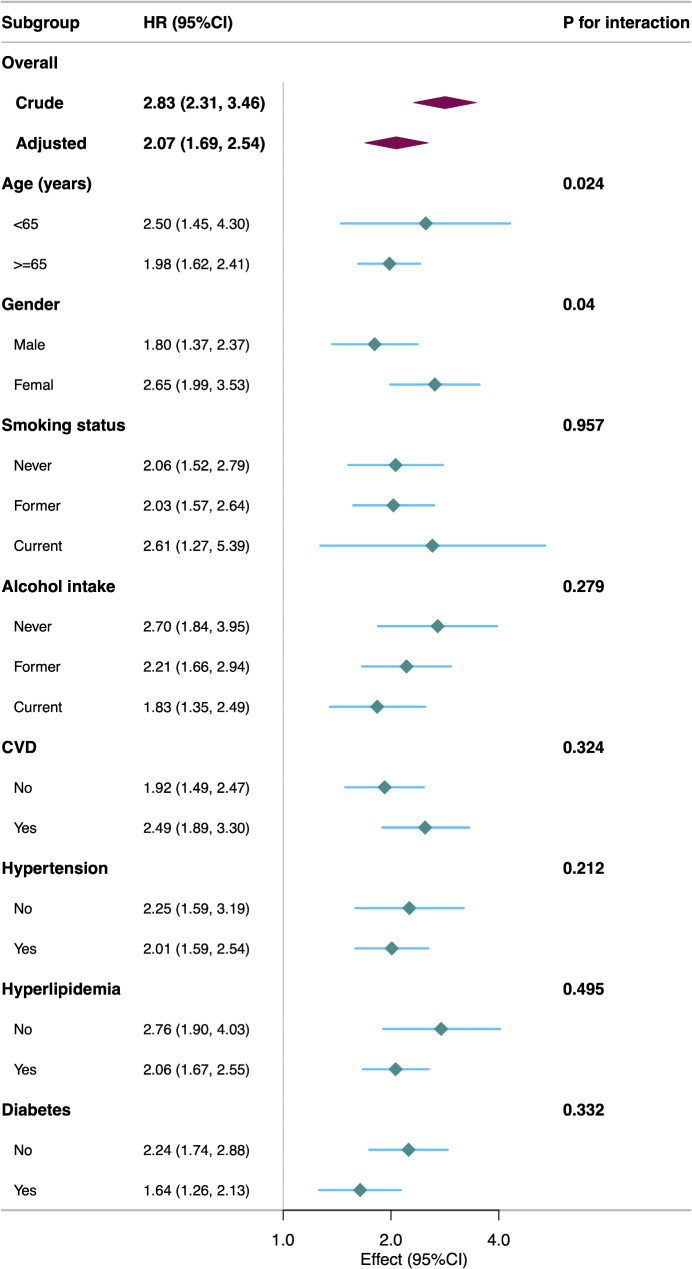
Results: Over a median follow-up of 9.16 years, 991 (unweighted) participants died. After adjusting for multiple covariates, PAA was significantly associated with increased risks of all-cause mortality (HR = 2.07; 95% CI: 1.69-2.54), cancer-specific mortality (HR = 2.15; 95% CI: 1.52-3.04), and non-cancer mortality (HR = 2.06; 95% CI: 1.66-2.57). Each one-unit increase in AAR was associated with a 4% increase in the risk of all-cause, cancer-specific, and non-cancer mortality (HR = 1.04; 95% CI: 1.03-1.05). RCS models indicated a linear dose-response relationship between AAR and mortality.
Conclusions: Among U.S. adult cancer survivors, PAA is significantly associated with all-cause, cancer-specific, and non-cancer mortality. PAA may serve as an important biomarker for predicting prognosis in cancer survivors.
Keywords: All-cause mortality; Biological aging; Cancer survivors; NHANES; Phenotypic age acceleration (PAA).
© 2025. The Author(s).
Conflict of interest statement
Declarations. Ethics statement: Ethics approval was obtained from the NCHS Ethics Review Committee, and participants provided written informed consent. Competing interests: The authors declare no competing interests.
Figures
Similar articles
-
Association between phenotypic age and mortality risk in individuals with obesity: a retrospective cohort study.Front Public Health. 2024 Dec 9;12:1505066. doi: 10.3389/fpubh.2024.1505066. eCollection 2024. Front Public Health. 2024. PMID: 39717032 Free PMC article.
-
The association between life's crucial 9 and all-cause, cancer-specific and cardiovascular mortality in US cancer survivors: a cohort study of NHANES.BMC Cancer. 2025 Apr 30;25(1):805. doi: 10.1186/s12885-025-14229-2. BMC Cancer. 2025. PMID: 40307773 Free PMC article.
-
Association between the systemic inflammation response index and mortality in cancer survivors based on NHANES 2001-2018.Sci Rep. 2025 Apr 30;15(1):15151. doi: 10.1038/s41598-025-99790-3. Sci Rep. 2025. PMID: 40307347 Free PMC article.
-
Association between oxidative balance score and all-cause and cancer-specific mortality among cancer survivors.Front Immunol. 2025 Mar 20;16:1541675. doi: 10.3389/fimmu.2025.1541675. eCollection 2025. Front Immunol. 2025. PMID: 40181979 Free PMC article.
-
Dose-response association between cardiovascular health and mortality in cancer survivors.Curr Probl Cardiol. 2024 Jan;49(1 Pt C):102176. doi: 10.1016/j.cpcardiol.2023.102176. Epub 2023 Nov 3. Curr Probl Cardiol. 2024. PMID: 37923028 Review.
Cited by
-
Aging acceleration, not chronological age, is associated with cognitive performance in older adults: A cross-sectional study on the protective role of physical activity.Medicine (Baltimore). 2025 Jul 18;104(29):e43431. doi: 10.1097/MD.0000000000043431. Medicine (Baltimore). 2025. PMID: 40696637 Free PMC article.
-
GrimAge and GrimAge2 Age Acceleration effectively predict mortality risk: a retrospective cohort study.Epigenetics. 2025 Dec;20(1):2530618. doi: 10.1080/15592294.2025.2530618. Epub 2025 Jul 14. Epigenetics. 2025. PMID: 40658048 Free PMC article.
References
MeSH terms
Grants and funding
LinkOut - more resources
Full Text Sources
Medical
