. 2025 Feb 25;26(1):37.
doi: 10.1186/s13059-025-03504-x.

Digital sequencing is improved by using structured unique molecular identifiers

Affiliations

Digital sequencing is improved by using structured unique molecular identifiers

Peter Micallef et al. Genome Biol. .

Abstract

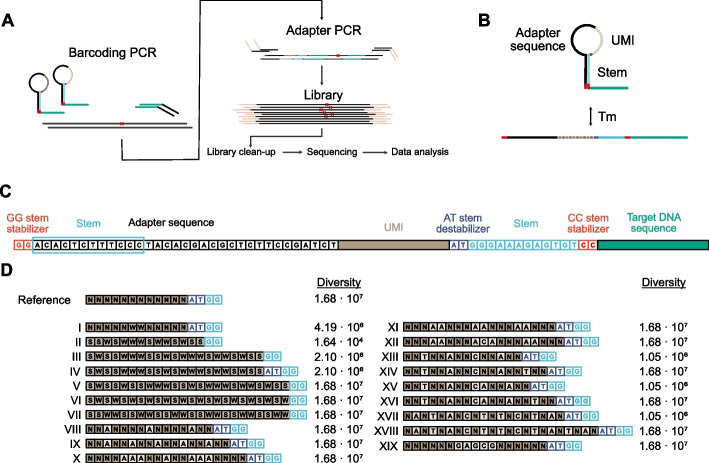
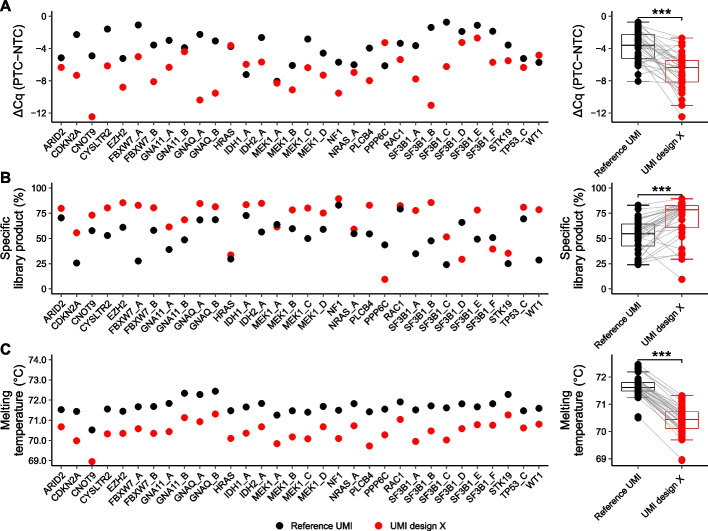
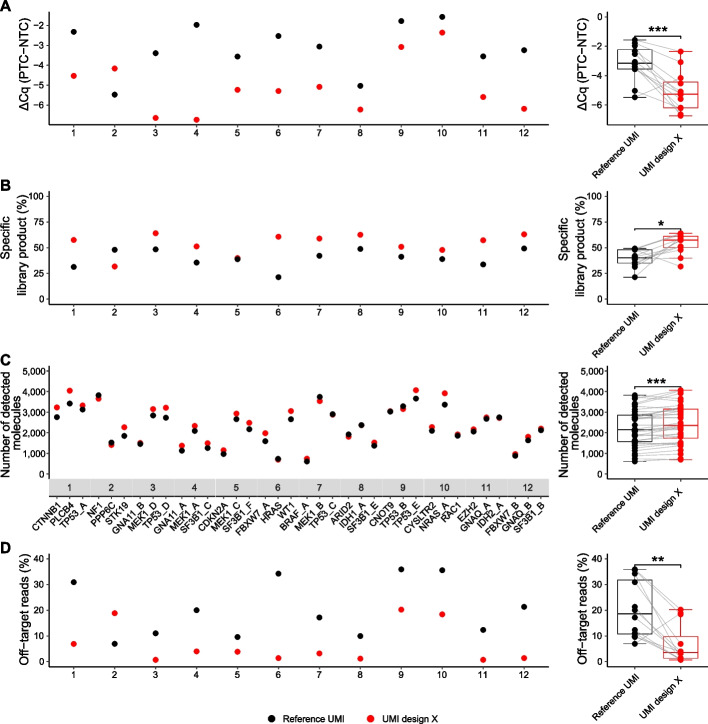
Digital sequencing uses unique molecular identifiers (UMIs) to correct for polymerase induced errors and amplification biases. Here, we design 19 different structured UMIs to minimize the capacity of primers to form non-specific PCR products during library construction using SiMSen-Seq, a PCR-based digital sequencing approach with flexible multiplexing capabilities suitable for tumor-informed mutation analysis. All structured UMI designs demonstrate enhanced assay performance compared with an unstructured reference UMI. The best performing structured UMI design shows significant improvements in all tested aspects of assay and sequencing performance with the ability to reliable detect low variant allele frequencies.

Keywords: Digital sequencing; Error-free sequencing; Molecular barcode; Sequencing; Unique molecular identifier.


Conflict of interest statement

Declarations. Ethics approval and consent to participate: This study was performed in accordance with the Declaration of Helsinki and approved by the Regional Ethical Review Board in Gothenburg (DNR 485–16, approved 23 June 2016; DNR T-795–16, approved 15 September 2016; DNR T525-18, approved 5 June 2018; and DNR 2021–04895, approved 24 October 2021). Informed consent was obtained. Consent for publication: The study subject has consented for publication. Competing interests: The use of structured unique molecular identifiers in SiMSen-Seq is patent pending. S.F. is employed by SiMSen Diagnostics. G.J. declares employment and stock ownership in SiMSen Diagnostics. A.S. is co-inventor of the SiMSen-Seq technology that is patent protected (U.S. Serial No.: 15/552,618). A.S. declares stock ownership in Tulebovaasta, Iscaff Pharma, and SiMSen Diagnostics and is a board member in Tulebovaasta.

Figures

Fig. 1
Fig. 1
Digital sequencing using structured UMIs. A Overview of the SiMSen-Seq workflow. In SiMSen-Seq, each double-stranded target DNA molecule generates on average two different UMIs after three cycles barcoding PCR and a threefold dilution before adapter PCR [53]. B Schematic structure and function of SiMSen-Seq barcode primers with stem-loop protected UMI. Stem opening is temperature dependent. Tm, melting temperature. C Design and sequence of forward SiMSen-Seq barcoding primers. Different primer elements are indicated by color and name. Blue box indicates the part of the adapter sequence that complementary hybridizes to the blue sequence to form the stem. The stem is stabilized by two nucleotide pairs (GG and CC stem stabilizers) and destabilized by two nucleotides (AT stem destabilizer). The AT stem destabilizer prevents the UMI from extending the stem length. D Design of structured UMIs. The sequence contexts of 19 structured UMIs, I–XIX, and the unstructured reference UMI are shown (for additional details, see Additional file 3: Table S4). Designs II, III, V, VI, and VII lack the AT stem destabilizer. Nucleotide N represents any nucleotide type; nucleotide S represents cytosine or guanine; nucleotide W represents adenine or thymine
Fig. 2
Fig. 2
Assay performance of different structured UMI designs. A Assay performance based on quantitative PCR. The relative specificity is indicated as ΔCq, calculated as the difference in cycle of quantification values between samples with 20 ng DNA (blue) and without DNA (turquoise). ΔCq equals one corresponds to a twofold difference in assay specificity, assuming 100% PCR efficiency. The figure shows the amplification curves of a representative assay (TP53_A, UMI design X, n = 3). B Assay performance based on parallel capillary electrophoresis. The black and red electropherograms exemplify representative libraries for a representative assay (TP53_A) with reference UMI and UMI design X, respectively, using 20 ng DNA, n = 1. C Relative specificity for all UMI designs based on quantitative PCR. Mean value for each individual assay is shown, n = 3. The mean of all assays is indicated by a bar for each individual UMI design. Data are normalized to the reference UMI, which is mean-centered. D Specificity for all UMI designs based on correct library product formation using parallel capillary electrophoresis. The percentage of specific library products relative total DNA amount is shown for six assays (n = 1) with mean indicated by a bar. E The final rank of all the different UMI designs based on their relative performance using both quantitative PCR (qPCR) and parallel capillary electrophoresis data. The order of UMI designs in C and D are based on their final ranks
Fig. 3
Fig. 3
Validation of improved assay performance using structured UMIs. Data for UMI design X and reference UMI are shown for 32 individual assays using 20 ng DNA. A Relative specificity using quantitative PCR. Mean ΔCq was calculated as the difference in cycle of quantification values between samples with DNA (PTC) and no template control (NTC). Mean value is shown for each assay and UMI design, n = 3. Box plots of all data are shown to the right. ***p ≤ 0.001, Wilcoxon signed-rank test, n = 32. B Specificity based on correct library product formation using parallel capillary electrophoresis. The percentage of specific library products relative total DNA amount is shown, n = 1. Box plots of all data are shown to the right. ***p ≤ 0.001, Wilcoxon signed-rank test, n = 32. C Melting temperatures of forward barcoding primers. Mean melting temperature is shown for each assay and both UMI designs, n = 2. Box plots of all data are shown to the right. ***p ≤ 0.001, Wilcoxon signed-rank test, n = 32
Fig. 4
Fig. 4
Evaluation of 12 different tri-plexes. Twelve tri-plexes were analyzed with UMI design X and reference UMI using 20 ng DNA. A Relative specificity using quantitative PCR. Mean ΔCq was calculated as the difference in cycle of quantification values between samples with DNA (PTC) and no template control (NTC). Mean value for each tri-plex is shown, n = 3. Box plots of all mean values are shown to the right. ***p ≤ 0.001, Wilcoxon signed-rank test, n = 12. B Specificity based on correct library product formation using parallel capillary electrophoresis. The percentage of specific library products relative total DNA amount is shown. Mean value for each tri-plex is shown, n = 3. Box plots of mean values are shown to the right. *p ≤ 0.05, Wilcoxon signed-rank test, n = 12. C Number of detected molecules assessed by digital sequencing. Mean value for each individual assay is shown, n = 3. Box plots of all mean values are shown to the right. ***p ≤ 0.001, Wilcoxon signed-rank test, n = 36. D Fraction of off-target sequence reads. Mean value for each tri-plex is shown, n = 3. Box plots of all mean values are shown to the right. **p ≤ 0.01, Wilcoxon signed-rank test, n = 12
Fig. 5
Fig. 5
Sensitivity to detect mutated DNA molecules. A A hot-spot mutation panel that consists of 20 individual assays was analyzed with three different dilutions of mutations standardized control material using UMI design X. Thirty-one mutations that were possible to dilute in wildtype control material were assessed in 100 ng DNA. The expected variant allele frequency ranged approximately around 0.1%, 0.025%, and 0.01% (Additional file 2: Table S1). The total number of detected molecules for each assay was uniform among all analyzed samples (Additional file 1: Fig. S21). Mean value for each mutation is shown, n = 4. Box plots of all mean values are shown to the right. ***p ≤ 0.001, Wilcoxon signed-rank test, n = 31. B The hot-spot mutation panel was used to assess the difference between UMI design X and reference UMI. The number of mutated molecules was quantified in 10 ng DNA. Note that three mutations were present also in the wildtype material, resulting in a total of 34 mutations. Mean value for each mutation is shown, n = 4. Box plots of all mean values are shown to the right. ***p ≤ 0.001, Wilcoxon signed-rank test, n = 34
Fig. 6
Fig. 6
Circulating tumor-DNA analysis in leiomyosarcoma. A Schematic workflow for identification and design of personalized ctDNA panels using SiMSen-Seq with structured UMIs (partially created in BioRender. Andersson, D. (2024) https://BioRender.com/z62n478). B Validation of mutations identified in tumor tissue using whole exome sequencing with a personalized SiMSen-Seq ctDNA panel. The Pearson correlation coefficient (r) was calculated, n = 18. VAF, variant allele frequency; WES, whole exome sequencing. C Variant allele frequencies for 18 patient-specific mutations in blood plasma during palliative chemotherapy in a patient diagnosed with leiomyosarcoma. Plasma samples were analyzed with a personalized SiMSen-Seq ctDNA panel. Treatments and results of radiological evaluations are shown at the top of the diagram. The variant allele frequencies are shown in log10-scale. The corresponding diagram with number of ctDNA molecules per mL plasma is shown in Additional file 1: Fig. S20B. PR, partial response; SD, stable disease; PD, progressive disease. D Overall variant allele frequency in blood plasma. The overall variant allele frequency shown in log10-scale was calculated as the total number of all detected ctDNA molecules divided by the total number of detected molecules for all assays. Treatments and results of radiological evaluations are shown at the top of the diagram. Open circles represent no detectable ctDNA. The corresponding diagram with number of ctDNA molecules per mL plasma is shown in Additional file 1: Fig. S20C. E Computed tomography of the pelvis (top) and the chest (bottom) at days 0, 189, and 280. Blue arrows indicate the primary tumor in the left ilium. Red arrows indicate lung metastases. F Number of detected mutations over time. Open circles represent no detectable ctDNA. G Number of detected mutations versus overall variant allele frequency. The overall variant allele frequencies are shown in log10-scale. The Pearson correlation coefficient (r) was calculated, n = 18. H Mutation heterogeneity over time. The heat map shows the variant allele frequency over time for each individual mutation. The rankings of mutations based on variant allele frequencies for the first and last time points are shown. Time points with no detectable ctDNA are shown in white color. I Variant allele frequencies in blood plasma versus tumor tissue. The Pearson correlation coefficient (r) was calculated, n = 18

References

    1. Fox EJ, Reid-Bayliss KS, Emond MJ, Loeb LA. Accuracy of next generation sequencing platforms. Next Gener Seq Appl. 2014;1:1000106. - PMC - PubMed
    1. Xu H, DiCarlo J, Satya RV, Peng Q, Wang Y. Comparison of somatic mutation calling methods in amplicon and whole exome sequence data. BMC Genomics. 2014;15: 244. - DOI - PMC - PubMed
    1. Stead LF, Sutton KM, Taylor GR, Quirke P, Rabbitts P. Accurately identifying low-allelic fraction variants in single samples with next-generation sequencing: applications in tumor subclone resolution. Hum Mutat. 2013;34:1432–8. - DOI - PubMed
    1. Andersson D, Kristiansson H, Kubista M, Ståhlberg A. Ultrasensitive circulating tumor DNA analysis enables precision medicine: experimental workflow considerations. Expert Rev Mol Diagn. 2021;21:299–310. - DOI - PubMed
    1. Heitzer E, Haque IS, Roberts CES, Speicher MR. Current and future perspectives of liquid biopsies in genomics-driven oncology. Nat Rev Genet. 2019;20:71–88. - DOI - PubMed

MeSH terms

LinkOut - more resources