. 2025 Feb 25;13(1):33.
doi: 10.1186/s40364-025-00746-6.

Single-cell multi-omics analysis identifies SPP1+ macrophages as key drivers of ferroptosis-mediated fibrosis in ligamentum flavum hypertrophy

Affiliations

Single-cell multi-omics analysis identifies SPP1+ macrophages as key drivers of ferroptosis-mediated fibrosis in ligamentum flavum hypertrophy

Chengshuo Fei et al. Biomark Res. .

Abstract

Background: Ligamentum flavum hypertrophy (LFH) is a primary contributor to lumbar spinal stenosis. However, a thorough understanding of the cellular and molecular mechanisms driving LFH fibrotic progression remains incomplete.

Methods: Single-cell RNA sequencing (scRNA-seq) was performed to construct the single-cell map of human ligamentum flavum (LF) samples. An integrated multi-omics approach, encompassing scRNA-seq, bulk RNA sequencing (bulk RNA-seq), and Mendelian randomization (MR), was applied to conduct comprehensive functional analysis. Clinical tissue specimens and animal models were employed to further confirm the multi-omics findings.

Results: ScRNA-seq provided a single-cell level view of the fibrotic microenvironment in LF, revealing significantly increased proportions of fibroblasts, myofibroblasts, and macrophages in LFH. Using transmission electron microscopy, single-cell gene set scoring, and MR analysis, ferroptosis was identified as a critical risk factor and pathway within LFH. Subcluster analysis of fibroblasts revealed functional heterogeneity among distinct subpopulations, highlighting the functional characteristics and the metabolic dynamics of fibroblast with a high ferroptosis score (High Ferro-score FB). The quantification of gene expression at single-cell level revealed that ferroptosis increased along with fibrosis in LFH specimens, a finding further validated in both human and mice tissue sections. Consistently, bulk RNA-seq confirmed increased proportions of fibroblasts and macrophages in LFH specimens, underscoring a strong correlation between these cell types through Spearman correlation analysis. Notably, subcluster analysis of the mononuclear phagocytes identified a specific subset of SPP1+ macrophages (SPP1+ Mac) enriched in LFH, which exhibited activation of fibrosis and ferroptosis-related metabolic pathways. Cell-cell communication analysis highlighted that SPP1+ Mac exhibited the strongest outgoing and incoming interactions among mononuclear phagocytes in the LFH microenvironment. Ligand-receptor analysis further revealed that the SPP1-CD44 axis could serve as a key mediator regulating the activity of High Ferro-score FB. Multiplex immunofluorescence confirmed substantial Collagen I deposition and reduced Ferritin Light Chain expression in regions with SPP1-CD44 co-localization in LFH specimens.

Conclusions: Our findings indicated that SPP1+ Mac may contribute to LFH fibrosis by regulating ferroptosis in High Ferro-score FB through the SPP1-CD44 axis. This study enhances our understanding of the cellular and molecular mechanisms underlying LFH progression, potentially improving early diagnostic strategies and identifying new therapeutic targets.

Keywords: Ferroptosis; Fibrosis; Ligamentum flavum hypertrophy; Macrophages.; Multi-omics analysis; Single-cell RNA sequencing.


Conflict of interest statement

Declarations. Ethics approval and consent to participate: The collection and analysis of human LF specimen were approved by the Medical Ethics committee of Nanfang Hospital of Southern Medical University (Approval No: NFEC-2022-175). Written informed consent was obtained from all of the patients for being included in the study before tissue donation. The animal experiments followed the National Institutes of Health guide for the care and use of Laboratory animals (NIH Publications No. 8023, revised 1978) and were approved by the Animal Experiment Ethics Committee of Nanfang Hospital of Southern Medical University (Approval No: nfyy-2021-1021). Consent for publication: Not applicable. Competing interests: The authors declare no competing interests.

Figures

Fig. 1
Fig. 1
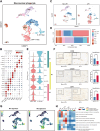
Comprehensive scRNA-seq analysis unveils the cellular landscape in human LF tissue. (A) Workflow of scRNA-seq, including sample collection, digestion, sequencing, and analysis. (B) Representative macroscopic images and lumbar MRI images from the non-LFH and LFH groups. (C) Heatmap showing the expression of the first five DEGs for different lineages. Red indicates the high expression, blue indicates the low expression. (D) UMAP visualization of 21,301 cells from the human LF tissue, dyed according to cell types. Fibroblasts and myofibroblasts are circled by the black dotted line. (E) Cell proportion plot showing the proportions of 16 cell groups in the non-LFH and LFH groups. The bar chart on the right shows their cell numbers. (F) Dot plot showing the expression of characteristic genes of different cell types. The size of the dot represents the proportion of expressing cells; the colors show the normalized gene expression intensity
Fig. 2
Fig. 2
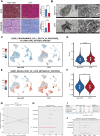
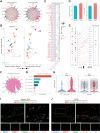
Ferroptosis may contribute as a potential risk factor for LFH. (A) Representative histopathological findings of LF tissue from the non-LFH and LFH groups (n = 5). In EVG staining, collagen fibers manifested red, and elastic fibers manifested black. In Masson’s trichrome staining, collagen fibers were stained blue, and elastic fibers were stained red. The accompanying bar graph presents the volume fractions (%) of elastic and collagen fibers in LF tissue as mean ± SD, with ***p < 0.001. Scale bar, 50 μm. (B) Representative TEM images of LF tissue from the non-LFH and LFH groups (n = 2). Scale bar: left, 5 μm; right, 500 nm. The red arrows indicate shrunken mitochondria. (C, E) UMAP plots illustrating the scoring results of the “PROGRAMMED CELL DEATH IN RESPONSE TO REACTIVE OXYGEN SPECIES” and the “REGULATION OF LIPID METABOLIC PROCESS” gene sets in scRNA-seq of the non-LFH group and the LFH group, with red indicating high scores and blue indicating low scores. (D, F) Bar graphs showing significant differences in gene set scores between the two groups (*p < 0.05,****p < 0.0001). (G) Scatter plot presenting the correlation between iron metabolism disorder and SCS across different MR methods. The x-axis represents the effect of individual SNPs on iron metabolism disorder, while the y-axis represents their effect on SCS. The slope of the line represents the causal effect for each method. (H) Forest plot demonstrating the causal effect of ferroptosis on SCS. Black dots represent the estimated effect of individual SNPs on SCS risk due to iron metabolism disorder, while red dots represent the overall effect estimated using MR-Egger and IVW methods. (I) Five methods were used in the forest plot to visualize the causal effects of iron metabolism disorders on SCS. (J) Leave-one-out sensitivity analysis: black dots represent the estimated causal effect of ferroptosis on LSS after removing each SNP, while red dots indicate the overall estimated causal effect on LSS after filtering SNPs. The x-axis shows the estimated effect of iron metabolism disorder on SCS after sequential removal of each SNP, and the y-axis shows all sequentially removed SNPs
Fig. 3
Fig. 3
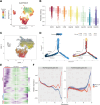
Definition and functional distinctions of fibroblast subpopulations highlight close association between ferroptosis and LF fibrosis. (A) UMAP visualization of fibroblast subclusters in human LF tissue, dyed according to the cell types. (B) Heatmap displaying the specific markers for each fibroblast cluster. Red indicates the high expression, and blue indicates the low expression. The box on the right presents the GO enrichment analysis results for the first 50 DEGs expressed in each fibroblast cluster. (C) UMAP plot (top) showing the ferroptosis scores of all cells, where red indicates High Ferro-score cells, blue indicates Low Ferro-score cells, and gray indicates no significant cells. The pie chart (bottom) showing the proportion of High Ferro-score FB, Low Ferro-score FB, and No significant FB in each fibroblast subpopulation. Heatmap (D) and radar chart (E) presenting significant changes in metabolic pathways related to iron and lipid metabolism across different fibroblast subpopulation. In heatmap, red indicates high activity and blue indicates low activity
Fig. 4
Fig. 4
Pseudotime analysis reveals the cell development trajectories of fibroblast subpopulations in LFH. (A) UMAP plot showing the distribution of CytoTRACE scores among fibroblast subpopulations. Dark blue represents lower scores (highly differentiated), while dark red indicates higher scores (less differentiated). (B) Box plot presenting the distribution of CytoTRACE scores across different fibroblast subsets. The level of differentiation is represented by the color gradient, from blue (highly differentiated) to red (less differentiated). (C) Single-cell RNA dynamics plot for fibroblast subpopulations showing cells within the blue rectangle as Starting Cells, with arrows indicating predicted developmental trajectories. Pseudotime order is illustrated by the color gradient from red (early pseudotime) to blue (late pseudotime). (D) Developmental pseudo-time (left) and the distribution of different cell types (right) in LF fibroblast subtypes were generated using Monocle2. Darker blue represents earlier pseudo-time. Each fibroblast subtype is labeled with a distinct color. Arrows indicating the differentiation directions of two cell fates: cell fate 1 and cell fate 2, where cell fate 1 represents MyoFB, and cell fate 2 represents ChoFB. (E) Heatmap showing expression profiles of different cell fates along pseudotime. DEGs (qval < 1e-5) are hierarchically clustered into three subclusters. (F) Shaded line plot showing the expression scores of pro-ferroptosis and anti-ferroptosis gene sets over pseudotime in non-LFH (blue) and LFH (red) samples
Fig. 5
Fig. 5
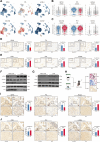
Ferroptosis levels increased with fibrosis in LFH in both human specimens and mouse models. (A) UMAP plots showing the expression levels of ferroptosis markers (GPX4, FTL, ACSL4) and fibrosis markers (COL1A2, FN1, ACTA2). Red indicates the high expression, and blue indicates the low expression. (B, C) Violin plots illustrating the expressions of GPX4, FTL, ACSL4, COL1A2, FN1, and ACTA2 in fibroblasts from non-LFH and LFH samples. ‘ns’ represent p > 0.05, ****p < 0.0001. (D) Representative IHC staining for GPX4, FTL, and ACSL4 in non-LFH and LFH samples (n = 5). Scale bar, 50 µm. Data quantification results are shown on the right, expressed as mean ± SD. (E) Representative IHC staining for COL1, FN1, and α-SMA in non-LFH and LFH samples (n = 5). Scale bar, 50 µm. Data quantization results are shown on the right. (F) Western blot analysis of GPX4, FTL, and ACSL4 protein expression in non-LFH and LFH samples (n = 3). (G) Western blot analysis of COL1, FN1, and α-SMA protein expression in non-LFH and LFH samples (n = 3). (H) Schematic illustration of the BS mouse model used to induce LFH. (I) Representative IHC staining for GPX4, FTL, and ACSL4 in control and BS mouse samples (n = 6). (J) Representative IHC staining for COL1, FN1, and α-SMA in control and BS mouse samples (n = 6). Scale bar, 50 µm. Data quantification results are shown on the right and displayed as mean ± SD. ***p < 0.001, ****p < 0.0001
Fig. 6
Fig. 6
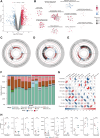
Integrated analysis of transcriptomics and BayesPrism deconvolution uncovers the close association between macrophages and fibroblasts. (A) Volcano plot showing the DEGs between the LFH group and the non-LFH group in the merged bulk RNA-seq data (|FC| > 1.5, p value < 0.05). Red dots indicate up-regulated LFH genes, blue dots indicate down-regulated LFH genes, and gray dots indicate genes with no significant differences. (B) Network Diagrams indicating network clustering based on GSEA gene set enrichment. The network was composed of enriched pathways with p < 0.05, with the circle sizes indicating the number of genes within each pathway. The color of the diagram reflects the NES, with red indicating positive and blue indicating negative. (C, D, E) GSEA circular plots showing the enrichment results of gene sets related to ECM and collagen formation, gene sets related to iron metabolism and lipid metabolism, and gene sets related to immunity and macrophages. (F) Bar plot indicating the cell composition proportions of each sample in the bulk RNA-seq data after BayesPrism deconvolution. (G) Heatmap showing the Spearman correlation analysis results between different cell types. Red indicates a positive correlation, while blue indicates a negative correlation. (H) Bar graphs illustrating the differences in cell proportions between the non-LFH group and the LFH group in the bulk RNA-seq data after deconvolution analysis. Red dots represent LFH group samples, while blue dots represent non-LFH group samples
Fig. 7
Fig. 7
Mononuclear phagocytic system lineage analysis reveals the potential function of SPP1+ Mac enriched in LFH. (A) UMAP of MPs in human LF tissue, dyed according to the cell types. SPP1+ Mac are circled by the black dotted line. (B) Dot plot displaying marker gene expression in different mononuclear phagocyte subpopulations, with color indicating the scaled mean expression of genes. (C) UMAP of MPs from the non-LFH group and the LFH group, dyed according to the cell types. (D) Bar graph showing the proportion of each mononuclear phagocyte subpopulation in the non-LFH group and the LFH group. (E) Stacked violin plot showing the expression of common markers in SPP1+ Mac and IL1B+ Mac, categorized into Mø, M1, and M2 types. (F) Representative IHC images showing the expression of CD86, CD206, and SPP1 in non-LFH and LFH samples. Scale bar, 50 μm. Data quantification results are presented on the right, as mean ± SD, with *p < 0.05, **p < 0.01, and ***p < 0.001. (G) UMAP plots showing M1 (left) and M2 (right) scoring results for each mononuclear phagocyte cluster, with yellow representing high scores and purple representing low scores. (H) Heatmap revealing GSVA scoring results for each mononuclear phagocyte cluster, with red indicating high scores and blue indicating low scores
Fig. 8
Fig. 8
Deciphering the complex interactions among multiple cell lineages in the fibrotic microenvironment of LFH. (A) Circos plots showing potential interactions between High Ferro-score FB and 15 immune cell clusters in the non-LFH (left) and LFH groups (right). Edge width indicates the number of significant L-R pairs between cell types. (B) Interaction strengths for incoming and outgoing signaling events among all clusters in non-LFH and LFH groups. The horizontal axis represents outgoing interaction strength, while the vertical axis represents incoming interaction strength. (C) Bubble plot illustrating communication probabilities of L-R interactions between SPP1+ Mac or IL1B+ Mac subclusters (sending signals) and High Ferro-score FB subcluster (receiving signals) in the up-regulated signaling pathways of the LFH group.Red characters represent ligands, and purple characters represent receptors. Bubble color and size represent calculated communication probabilities and p-values, respectively. (D) Comparison of the number and strength of inferred cellular interactions in the non-LFH and LFH groups. (E) Bubble connectivity plot displaying upregulated receptor-ligand pairs from signaling pathways in the LFH group, and their expression levels in corresponding cell clusters. The color of the bubble reflects the communication probability, and the bubble size indicates the percentage expression of L-R pairs. (F) Circle plot of inferred SPP1 signaling networks among SPP1+ Mac and other cell clusters. (G) Bar graph showing the distribution of L-R pairs between SPP1+ Mac and High Ferro-score FB. (H) Violin plots showing the expression difference of ligand SPP1 between SPP1+ Mac in non-LFH and LFH groups, and of receptor CD44 expression in High Ferro-score FB between non-LFH and LFH groups. ****p < 0.0001. (I-J) Representative multiplex immunofluorescent images of LF tissue from non-LFH and LFH groups showing the expression of SPP1 (red), CD44 (green), COL1 (orange), and FTL (purple). Nuclei are labeled with DAPI (blue). Scale bar, left, 100 μm; bottom, 100 μm; right, 20 μm
Fig. 9
Fig. 9
Schematic illustration of the fibrotic microenvironment during LFH degeneration. SPP1+ Mac regulate ferroptosis in fibroblasts through the SPP1-CD44 axis, thereby driving fibrosis in LFH

References

    1. Xiang Q, Zhao Y, Lin J, Jiang S, Li W. Epigenetic modifications in spinal ligament aging. Ageing Res Rev. 2022;77:101598. - PubMed
    1. Ravindra VM, Senglaub SS, Rattani A, Dewan MC, Härtl R, Bisson E, et al. Degenerative lumbar spine disease: estimating global incidence and worldwide volume. Glob Spine J. 2018;8:784–94. - PMC - PubMed
    1. Katz JN, Zimmerman ZE, Mass H, Makhni MC. Diagnosis and management of lumbar spinal stenosis: a review. JAMA. 2022;327:1688–99. - PubMed
    1. Fehlings MG, Tetreault L, Nater A, Choma T, Harrop J, Mroz T, et al. The aging of the global population: the changing epidemiology of disease and spinal disorders. Neurosurgery. 2015;77:S1–5. - PubMed
    1. Sun C, Zhang H, Wang X, Liu X. Ligamentum Flavum fibrosis and hypertrophy: molecular pathways, cellular mechanisms, and future directions. FASEB J. 2020;34:9854–68. - PubMed

LinkOut - more resources