. 2025 Jan 31;15(2):200.
doi: 10.3390/biom15020200.

Classical Swine Fever Virus Envelope Glycoproteins Erns, E1, and E2 Activate IL-10-STAT1-MX1/OAS1 Antiviral Pathway via Replacing Classical IFNα/β

Affiliations

Classical Swine Fever Virus Envelope Glycoproteins Erns, E1, and E2 Activate IL-10-STAT1-MX1/OAS1 Antiviral Pathway via Replacing Classical IFNα/β

Liyuan Zhang et al. Biomolecules. .

Abstract

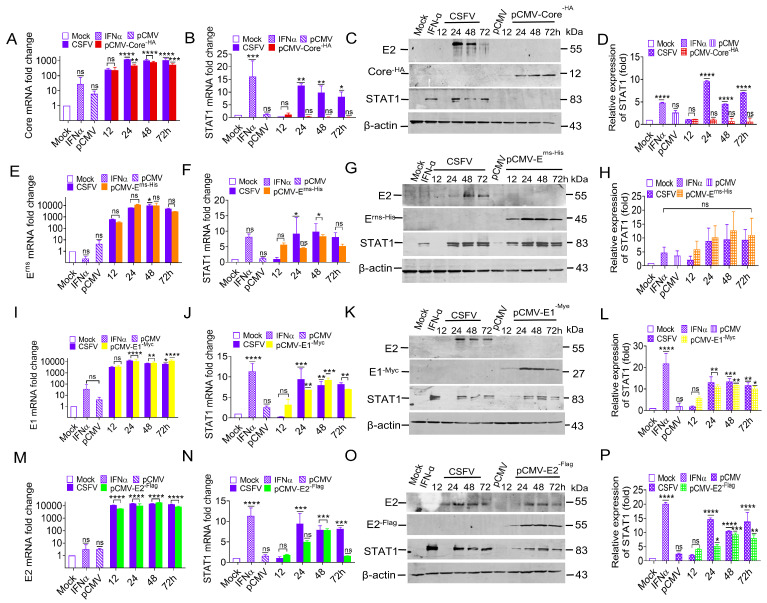
Classical swine fever (CSF) is an acute and often fatal disease caused by CSF virus (CSFV) infection. In the present study, we investigated the transcriptional profiles of peripheral blood mononuclear cells (PBMCs) in pigs infected with CSFV. The results revealed that CSFV inhibits IFNα/β production, but up-regulates the expression of signal transducer and activator of transcription 1 (STAT1); this result was verified in vitro. Interestingly, STAT1 is typically a downstream target of IFNα/β, raising the question of how CSFV can inhibit IFNα/β expression, yet up-regulate STAT1 expression. To explore this further, we observed that UV-treated CSFV induced STAT1 expression. Our results demonstrated that CSFV Erns, E1, and E2 could up-regulate STAT1 expression within the host cell cytoplasm and facilitate its translocation into the nucleus. The Erns, E1, and E2 proteins also separately induced the up-regulation of interleukin (IL)-10; IL-10 acts as the communicator connecting Erns, E1, and E2 proteins to STAT1, leading to the subsequent up-regulation, phosphorylation, and nuclear translocation of STAT1. Silencing of IL-10 down-regulated STAT1 expression. Finally, MX1 and OAS1 were identified as downstream targets of the IL-10-STAT1 pathway. In summary, a novel IL-10-STAT1 pathway independent of IFNα/β induced by CSFV Erns, E1, and E2 was identified in this study.

Keywords: CSFV; MX1; OAS1; STAT1; interleukin-10; surface glycoproteins.


Conflict of interest statement

The authors declare no conflicts of interest.

Figures

Figure 1
Figure 1
IFNα/β down-regulation and STAT1 up-regulation in response to CSFV. (A,B) The mRNA levels and protein expression of IFNα and IFNβ were analyzed in PK-15 cells infected with CSFV (MOI = 1) or transfected with 50 μg poly(I:C) by RT-qPCR (A) and WB (B) analysis. (D) The mRNA levels of STAT1 were analyzed in PK-15 cells infected with the CSFV (MOI = 1) at 0, 3, 6, 9, 12, 24, 36, and 48 hpi by RT-qPCR analysis. (E) The protein levels of E1/E2, STAT1, and P-STAT1 (Tyr 701) were analyzed by WB analysis. (C,F) The relative expression values of IFNα, IFNβ, STAT1, and P-STAT1 proteins were quantified using Image J software (* p < 0.05, ** p < 0.01, *** p < 0.001, **** p < 0.0001). Original images of the western blots can be found at Supplementary Materials.
Figure 2
Figure 2
STAT1 expression was up-regulated by UV-treated CSFV in vitro. (A) PK-15 cells were inoculated with CSFV and UV-treated CSFV at 101, 102, 103, and 104 TCID50. CSFV replication was assessed using an anti-CSFV E2 Ab at 48 hpi by IF analysis. CSFV gRNA (B) and STAT1 mRNA (C) levels in PK-15 cells inoculated with CSFV and UV-treated CSFV at 12, 24, 48, and 72 hpi were determined by RT-qPCR analysis. (D) CSFV E2 and STAT1 protein levels at 12, 24, 48, and 72 hpi were measured by WB analysis. (E) The relative expression values of STAT1 protein were quantified using Image J software (* p < 0.05, ** p < 0.01, *** p < 0.001, **** p < 0.0001). Original images of the western blots can be found at Supplementary Materials.
Figure 2
Figure 2
STAT1 expression was up-regulated by UV-treated CSFV in vitro. (A) PK-15 cells were inoculated with CSFV and UV-treated CSFV at 101, 102, 103, and 104 TCID50. CSFV replication was assessed using an anti-CSFV E2 Ab at 48 hpi by IF analysis. CSFV gRNA (B) and STAT1 mRNA (C) levels in PK-15 cells inoculated with CSFV and UV-treated CSFV at 12, 24, 48, and 72 hpi were determined by RT-qPCR analysis. (D) CSFV E2 and STAT1 protein levels at 12, 24, 48, and 72 hpi were measured by WB analysis. (E) The relative expression values of STAT1 protein were quantified using Image J software (* p < 0.05, ** p < 0.01, *** p < 0.001, **** p < 0.0001). Original images of the western blots can be found at Supplementary Materials.
Figure 3
Figure 3
CSFV up-regulated STAT1 expression via Erns, E1, and E2, but not the Core protein. PK-15 cells were infected with CSFV (MOI = 1) and separately transfected with 1.0 μg of the recombinant eukaryotic expression vectors pCMV-Core-HA (AD), pCMV-Erns-His (EH), pCMV-E1-Myc (IL), and pCMV-E2-Flag (MP). PK-15 cells incubated with 100 IU/mL of IFNα served as the positive control, while PK-15 cells transfected with an empty pCMV vector were utilized as the negative control. Samples were collected 72 h later for subsequent analysis. CSFV Core (A), Erns (E), E1 (I), E2 (M), and STAT1 (B,F,J,N) mRNA levels were measured by RT-qPCR analysis at 12, 24, 48, and 72 h. (C,G,K,O) CSFV E2, Core-HA, Erns-His, E1-Myc, E2-Flag, and STAT1 protein levels at 12, 24, 48, and 72 h were measured by WB analysis. (D,H,L,P) The relative expression values of STAT1 protein were quantified using Image J software (* p < 0.05, ** p < 0.01, *** p < 0.001, **** p < 0.0001). Original images of the western blots can be found at Supplementary Materials.
Figure 4
Figure 4
STAT1 translocation to the nucleus induced by CSFV Erns, E1, and E2. PK-15 cells were used to express Erns, E1, and E2 proteins by transfecting with the pCMV-Erns-His, pCMV-E1-Myc, and pCMV-E2-Flag vectors, respectively. (A,C,E) The protein levels of STAT1 in the cytoplasm and nucleus of PK-15 cells were measured by WB analysis. (B,D,F) The relative expression values of STAT1 protein were quantified using Image J software. (G) HEK 293T cells were separately transfected with the pcDNA3.0-STAT1-His, pCMV-Erns-His, pCMV-E1-Myc, and pCMV-E2-Flag vectors, and treated with IFNα (100 IU/mL). The expression of STAT1 (a–f) and P-STAT1 (g–l) proteins were evaluated at 48 h using anti-STAT1 and anti-P-STAT1 antibodies by IFA analysis (* p < 0.05, ** p < 0.01, *** p < 0.001, **** p < 0.0001). Original images of the western blots can be found at Supplementary Materials.
Figure 5
Figure 5
Identification of genes upstream of the STAT1 pathway during CSFV infection. (A) A heatmap of changes to the transcriptional levels of IL-8, IL-10, TGFβ1, TGFβ3 CCR2, CCR3, IFNγ, and STAT1 in PBMCs of piglets infected with CSFV. (B) PK-15 cells were infected with CSFV (MOI = 1) and the CSFV gRNA copy number was measured by RT-qPCR analysis. (C) The transcriptional levels of porcine IL-8, IL-10, TGFβ1, TGFβ3 CCR2, CCR3, and IFNγ at 12, 24, 48, and 60 hpi were measured by RT-qPCR analysis. (D, E) The relative protein expression of CSFV E2 (D) and IL-10 (E) were measured by ELISA (* p < 0.05, ** p < 0.01, *** p < 0.001, **** p < 0.0001).
Figure 6
Figure 6
Erns, E1, and E2 separately induced IL-10 up-regulation in vitro. PK-15 cells were separately transfected with the pCMV-Erns-His, pCMV-E1-Myc, and pCMV-E2-Flag vectors (1.0 μg). (AF) The mRNA levels of viral Erns (A), E1 (C), and E2 (E), and porcine IL-8, IL-10, TGFβ1, TGFβ3, CCR2, CCR3, and IFNγ in PK-15 cells (B,D,F) at 12, 24, 36, and 48 hpt were measured by RT-qPCR analysis. The protein levels of viral Erns (G), E1 (I), and E2 (K) and porcine IL-10 (H,J,L) at 12, 24, 36, and 48 hpt were measured by ELISA (* p < 0.05, ** p < 0.01, *** p < 0.001, **** p < 0.0001).
Figure 7
Figure 7
IL-10 up-regulated STAT1 expression in vitro. (A,B) Following porcine IL-10 (100 IU/mL) and porcine IFNα (100 IU/mL) treatment, the transcription and protein levels of STAT1 at 12, 24, 36, and 48 h were measured by RT-qPCR and WB analysis. (C) The relative expression values of STAT1 protein were quantified using Image J software. (D) Subcellular localization of STAT1 in PK-15 cells separately treated with IL-10 (100 IU/mL) and IFNα (100 IU/mL). The expression of STAT1 (a–c) and P-STAT1 (d–f) proteins were evaluated at 48 h using anti-STAT1 and anti-P-STAT1 antibodies by IFA analysis (* p < 0.05, ** p < 0.01, *** p < 0.001, **** p < 0.0001). Original images of the western blots can be found at Supplementary Materials.
Figure 8
Figure 8
Knockdown of IL-10 down-regulated STAT1 expression. The transcription and protein levels of Erns, E1, E2, IL-10, and STAT1 have been detected by RT-qPCR, ELISA, and WB analysis in PK-15 cells temporarily transfected with IL-10 siRNA or control siRNA (100 nM) for 6 h, and then transfected with the pCMV-Erns-His (AF), pCMV-E1-Myc (GL), or pCMV-E2-Flag (MR) vectors, respectively, underlying the transfection of the empty vector pCMV (1.0 μg) as a negative control at 12, 24, 36, and 48 hpt. The mRNA levels of Erns, E1, and E2 (A,G,M), IL-10 (B,H,N), and STAT1 (D,J,P) are displayed by RT-qPCR analysis. The protein levels of IL-10 (C,I,O) and STAT1 (E,K,Q) were detected by ELISA and WB analysis. (F,L,R) The relative expression values of the STAT1 protein were quantified using Image J software (* p < 0.05, ** p < 0.01, *** p < 0.001, **** p < 0.0001). Original images of the western blots can be found at Supplementary Materials.
Figure 9
Figure 9
Identification of downstream targets of the STAT1 pathway. (A,B) The copy number of CSFV gRNA and the mRNA levels of porcine MX1, OAS1, and ISG20 were quantified through RT-qPCR analysis at 12, 24, 36, and 48 hpi in PK-15 cells infected with CSFV (MOI = 1). (C) The protein levels were assessed using Western blot (WB) analysis. (D) The mRNA levels of porcine STAT1, MX1, OAS1, and ISG20 were quantified using RT-qPCR analysis at 12, 24, 36, and 48 hpt in PK-15 cells transfected with the pcDNA3.0-STAT1-His vector, and (E) protein levels were assessed through WB analysis. (F) The mRNA levels of porcine STAT1, MX1, OAS1, and ISG20 were quantified using RT-qPCR analysis at 12, 24, 36, and 48 hpi in CSFV-infected PK-15STAT1-/- cells and (G) protein levels were measured by WB analysis (** p < 0.01, *** p < 0.001, **** p < 0.0001). Original images of the western blots can be found at Supplementary Materials.
Figure 10
Figure 10
Substitution of the classical IFNα/β-STAT1 pathway with the IL-10-STAT1 pathway during CSFV infection. The type I IFN-mediated STAT1 pathway was replaced with the alternative IL-10-STAT1 pathway during CSFV infection via the viral envelope glycoproteins Erns, E1, and E2. The classical pathway: IFNα/β-p-STAT1/p-STAT2-IRF9-ISGs (left panel). The alternative pathway: IL-10-p-STAT1-MX1/OAS1 (right panel).

Similar articles

Cited by

References

    1. Luo Y., Li S., Sun Y., Qiu H.-J. Classical swine fever in China: A minireview. Vet. Microbiol. 2014;172:1–6. doi: 10.1016/j.vetmic.2014.04.004. - DOI - PubMed
    1. Postel A., Moennig V., Becher P. Classical swine fever in Europe--the current situation. Berl. Munch. Tierarztl. Wochenschr. 2014;126:468–475. - PubMed
    1. Nishi T., Fukai K., Kato T., Sawai K., Yamamoto T. Genome variability of classical swine fever virus during the 2018–2020 epidemic in Japan. Vet. Microbiol. 2021;258:109128. doi: 10.1016/j.vetmic.2021.109128. - DOI - PubMed
    1. Moennig V. Introduction to classical swine fever: Virus, disease and control policy. Vet. Microbiol. 2000;73:93–102. doi: 10.1016/S0378-1135(00)00137-1. - DOI - PubMed
    1. Yao J., Su L., Wang Q., Gao L., Xie J., He Y., Shu X., Song C., Chai J., Zhang Y., et al. Epidemiological investigation and phylogenetic analysis of Classical Swine Fever virus in Yunnan province from 2015 to 2021. J. Veter-Sci. 2022;23:e57. doi: 10.4142/jvs.22042. - DOI - PMC - PubMed

MeSH terms

LinkOut - more resources