. 2025 Feb 14;14(4):635.
doi: 10.3390/foods14040635.

Effect of Food Matrix on Regulation of Intestinal Barrier and Microbiota Homeostasis by Polysaccharides Sulfated Carrageenan

Affiliations

Effect of Food Matrix on Regulation of Intestinal Barrier and Microbiota Homeostasis by Polysaccharides Sulfated Carrageenan

Xuke Shang et al. Foods. .

Abstract

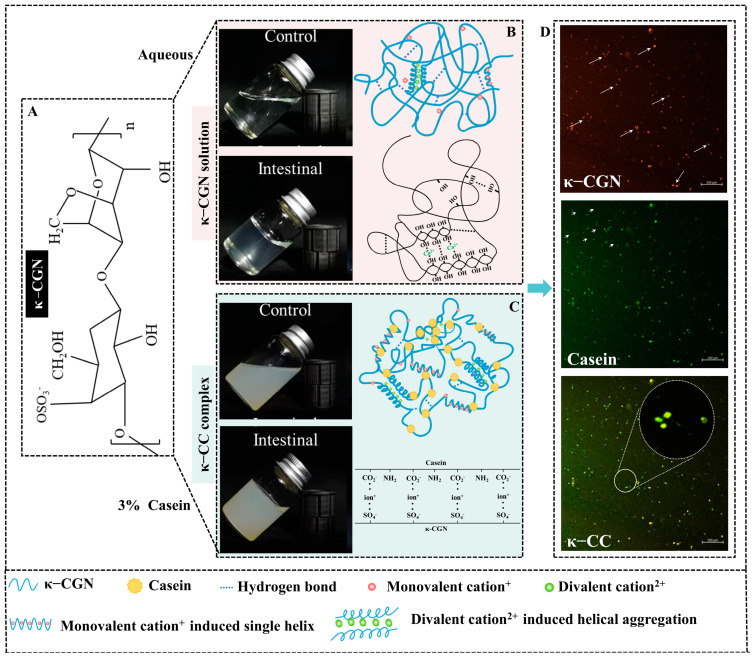
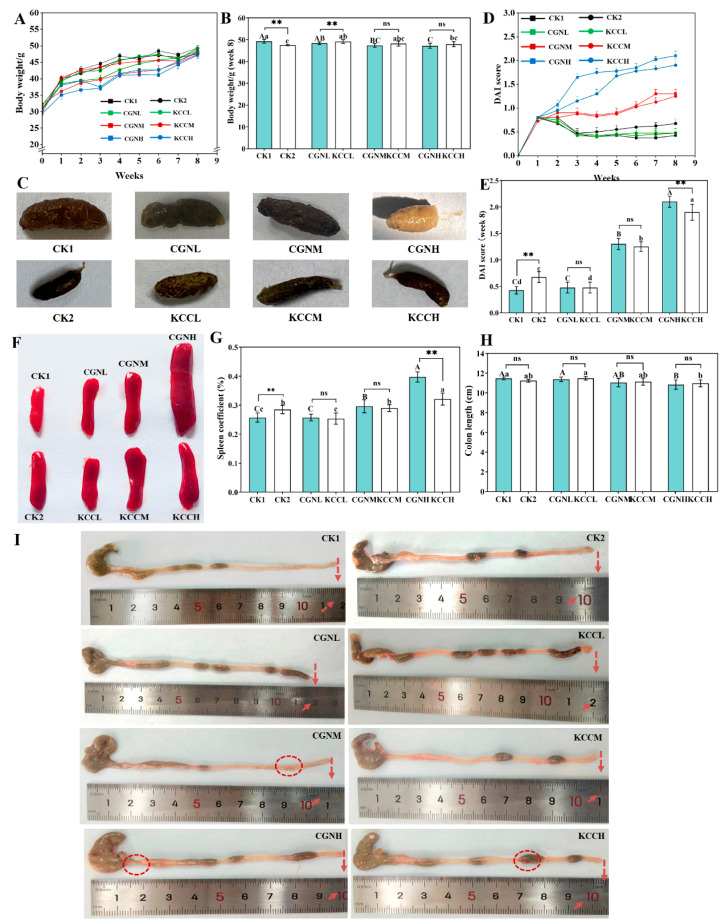
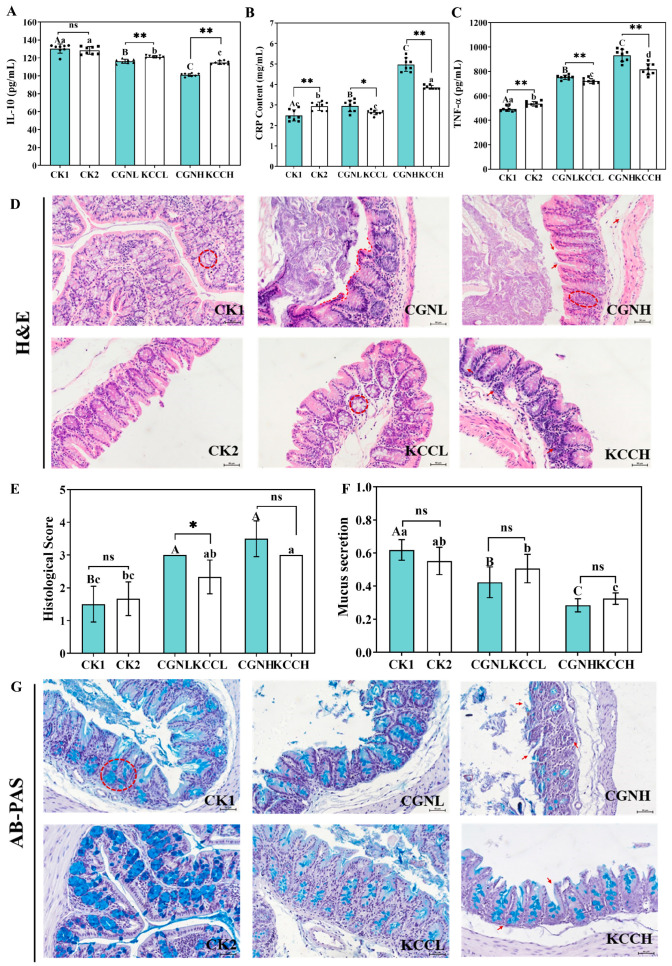
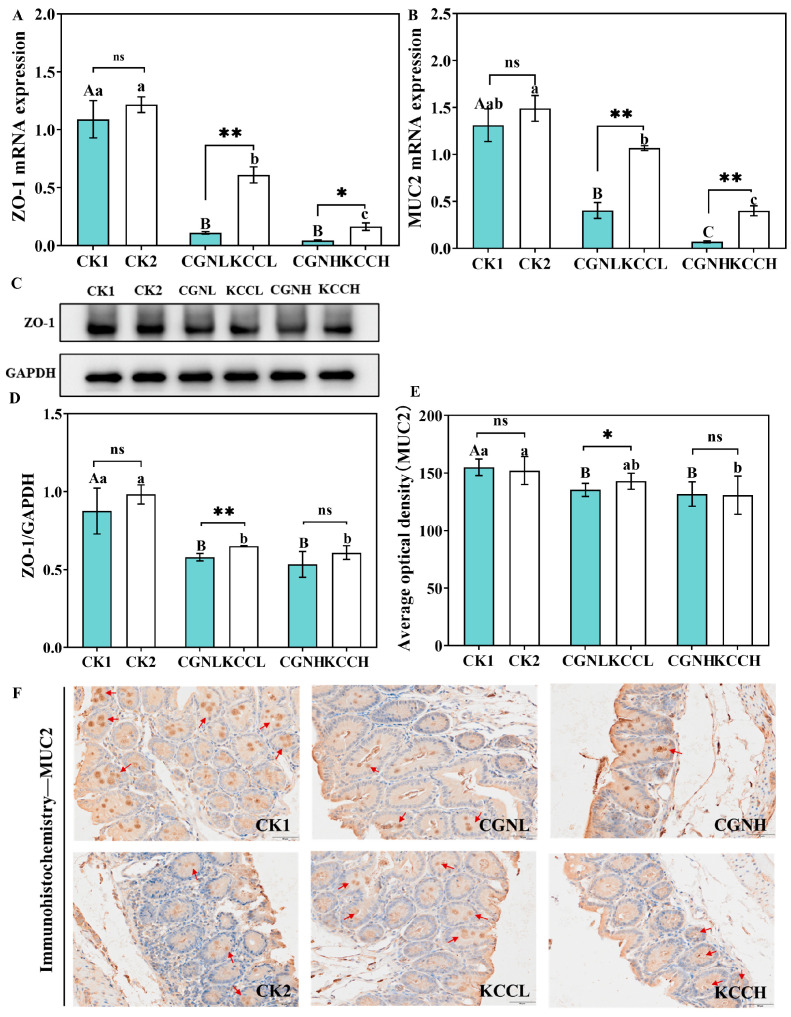
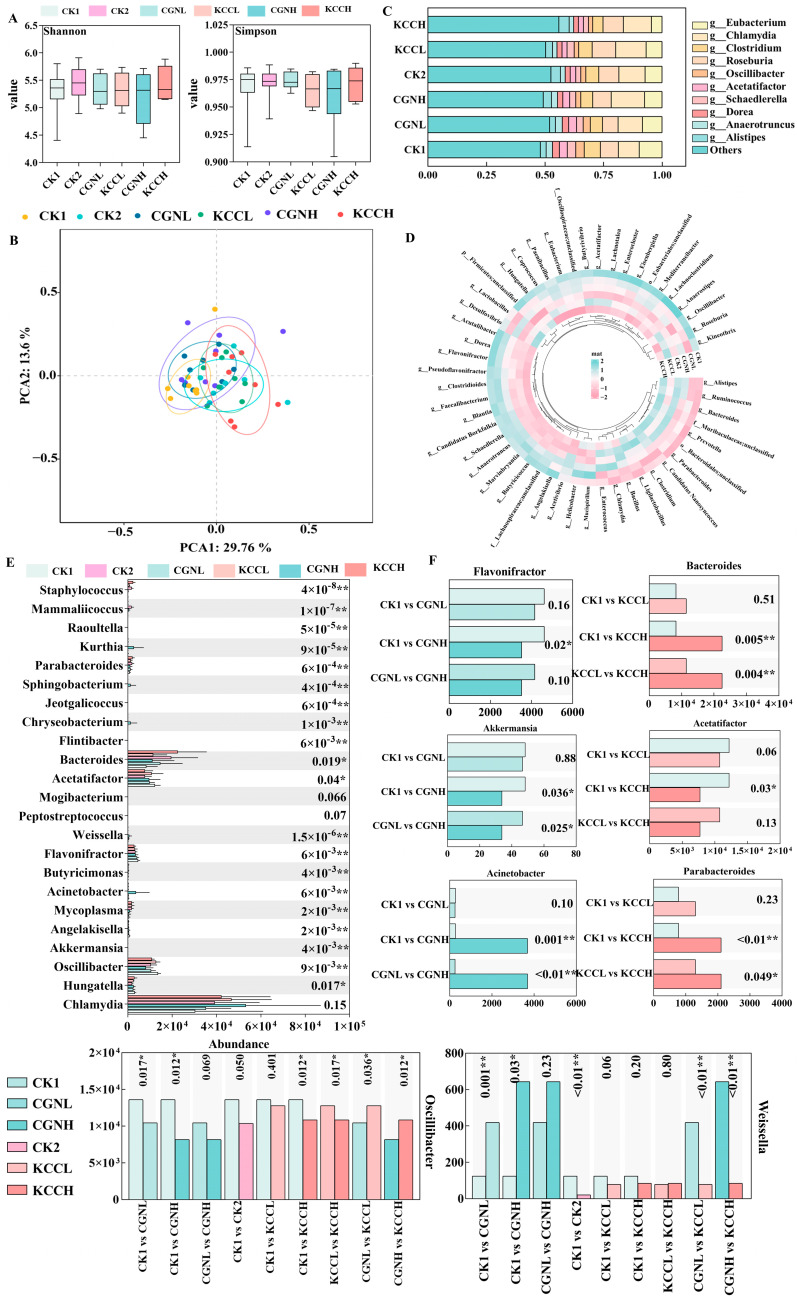
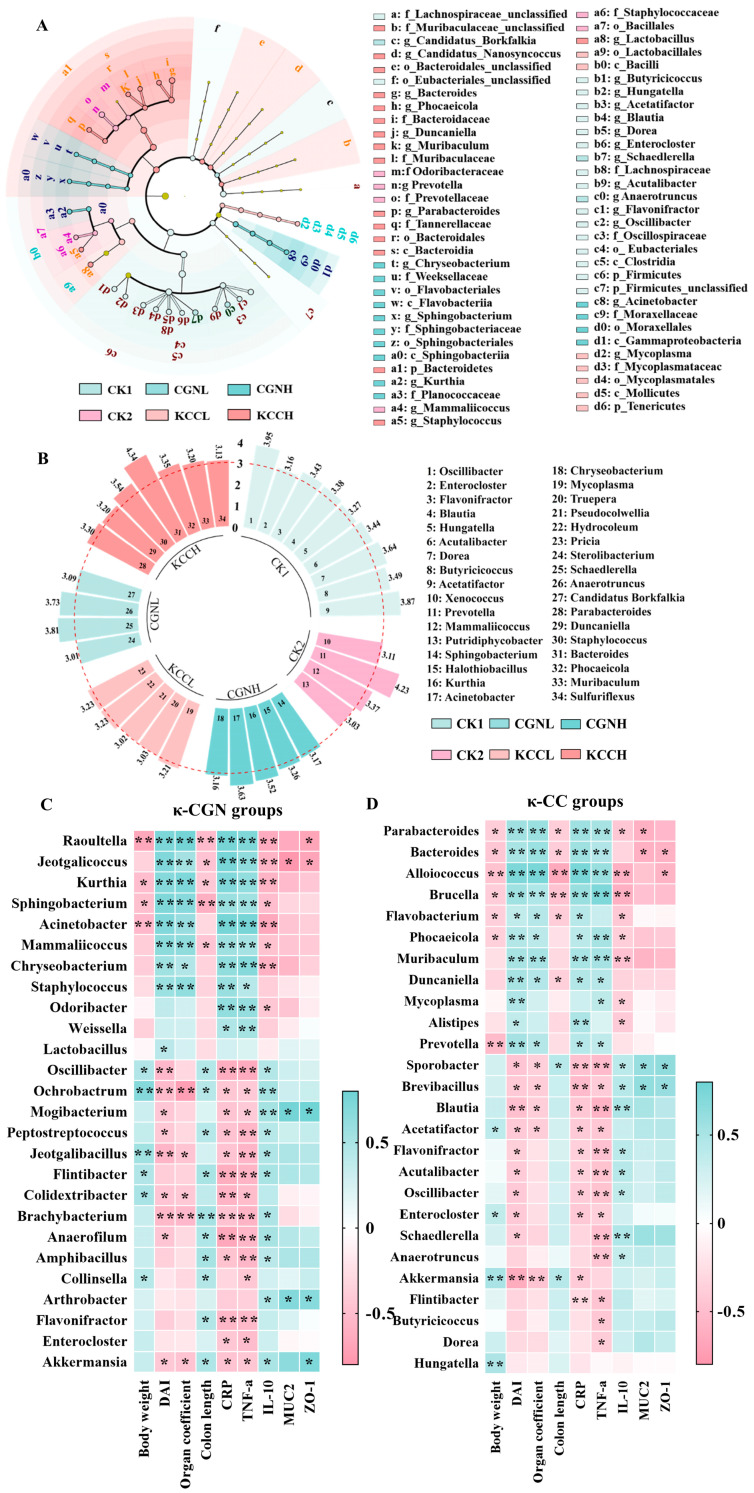
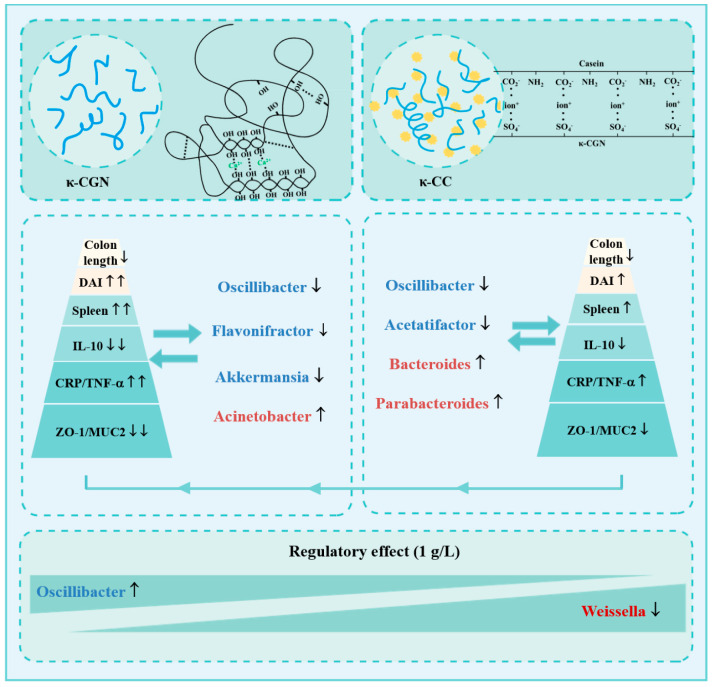
Carrageenan (CGN) has side effects on the intestinal barrier. Damage to the intestinal barrier is associated with exposure to sulfate groups. Food matrix has significant influence on the exposure quantity of sulfate groups and conformation in κ-CGN, but the corresponding side effects are not reported specifically. This study aimed to explore the regulatory effect of κ-CGN dissolved in aqueous (κ-CGN) and in 3% casein (κ-carrageenan-casein, κ-CC) on the intestinal barrier and microbiota homeostasis. Research has shown that both κ-CGN and κ-CC can induce different extents of intestinal barrier damage through disrupting microbiota homeostasis. Importantly, κ-CGN in casein with lower sulfate groups content was found to repair the intestinal barrier injury induced by an equivalent dose of κ-CGN aqueous through increasing the abundance of Oscillibacter and decreasing Weissella. These alleviating effects were reflected in lower levels of tumor necrosis factor (TNF)-α and C-reaction protein (CRP), higher levels of interleukin (IL)-10, raised secretion of mucus and goblet cells, and improved expression of epithelial cell compact proteins zonula occluden (ZO)-1 and mucin protein 2 (MUC2). This study states that κ-CGN in casein has a positive regulatory effect on the intestinal barrier damage compared to in aqueous solution, which can provide guidance for processing and utilization of CGN.

Keywords: Oscillibacter; carrageenan; casein; gut microbiota; intestinal barrier; sulfate group.


Conflict of interest statement

The authors are approved by all authors for publication and declare no competing financial interest.

Figures

Figure 1
Figure 1
The conformational characterizations of the κ-CGN and κ-CC. (A) The basic unit structures of κ-CGN. (B) Physical diagram and conformational characterizations of the κ-CGN in the simulated intestinal phase. (C) Physical diagram and conformational characterizations of the κ-CC in the simulated intestinal phase. (D) Confocal laser scanning microscopy images. The arrows indicate the microscopic morphological features of the sample observed under laser confocal microscopy. κ-CGN appears green while casein is red/orange.
Figure 2
Figure 2
Effect of κ-CGN and κ-CC on colitis in mice (n = 8 for each group). (A) Body weight change from week 1 to 8. (B) Body weight change at week 8. (C) Fecal condition. (D) DAI scores change from week 1 to 8. (E) DAI scores change at week 8. (F) Spleen changes. (G) Spleen organ index at week 8. (H) Colon length change at week 8. (I) Colon condition. The arrows indicate the length of the colon, and the circles indicate the occurrence of congestion. Independent samples t-tests were used for a single comparison of differences between groups and multiple comparisons were performed using the Turkey post hoc test after a significant one-way ANOVA (p < 0.05). Uppercase letters represent differences within the κ-CGN groups, lowercase letters represent differences within the κ-CC groups. “*” represents differences between the κ-CGN and κ-CC groups (p < 0.05) and “**” represents differences between the κ-CGN and κ-CC groups (p < 0.01).
Figure 3
Figure 3
Effects of κ-CGN and κ-CC on inflammatory cytokines and the intestinal barrier (n = 8 for each group). (AC) Serum inflammatory cytokines levels of TNF-α, CRP, and IL-10. (D) Images of HE staining. The dotted line indicates the surface of the irregular crypt and arrows indicate infiltration of inflammatory cells. (E) HAI scores. (F) Quantification of mucus secretion. (G) Images of AB-PAS staining. Circles and arrows indicate acidic mucus staining. Independent samples t-tests were used for a single comparison of differences between groups and multiple comparisons were performed using the Turkey post hoc test after a significant one-way ANOVA (p < 0.05). Uppercase letters represent differences within the κ-CGN groups, lowercase letters represent differences within the κ-CC groups. “*” represents differences between the κ-CGN and κ-CC groups (p < 0.05) and “**” represents differences between the κ-CGN and κ-CC groups (p < 0.01). scale bar = 50 μm.
Figure 4
Figure 4
Effect of κ-CC and κ-CGN on the expression of ZO-1 and MUC2 in mice (n = 8 for each group). (A,B) The mRNA levels of ZO-1 and MUC2. (C,D) Western bolt results and the protein expression of ZO-1. (E) The protein expression of MUC2. (F) Immunohistochemistry staining. The arrows indicated MUC2 staining. Independent samples t-tests were used for a single comparison of differences between groups and multiple comparisons were performed using the Turkey post hoc test after a significant one-way ANOVA (p < 0.05). Uppercase letters represent differences within the κ-CGN groups, lowercase letters represent differences within the κ-CC groups. “*” represents differences between the κ-CGN and κ-CC groups (p < 0.05) and “**” represents differences between the κ-CGN and κ-CC groups (p < 0.01). scale bar = 50 μm.
Figure 5
Figure 5
Effect of κ-CGN and κ-CC on the gut microbiota at genus (n = 8 for each group). (A) Alpha diversity. (B) Beta diversity. (C) Stacked column plot of microbial genus relative abundance. (D) Heatmap analysis of relative abundance of top 50 genera. (E) The Kruskal–Wallis test results for comparison of microbial abundance among six groups. (F) Relative abundance of differential bacteria in κ-CGN and κ-CC groups, which were calculated by a Wilcoxon rank sum test, * p < 0.05, and ** p < 0.01.
Figure 6
Figure 6
LEfSe analysis of gut microbiota and Spearman’s analysis between the microbiota and biochemical indexes. (A) Taxonomic cladogram obtained from LEfSe analysis among six groups. Different colors indicate the enrichment of the biomarker taxa. The circle from inside to outside means the rank from kingdom to genus, and the circle size represents the taxa abundance in the community. (B) Circle bar of LDA scores from LEfSe analysis at genus (LDA > 3). (C) Correlation analysis of characteristic microbiota and biochemical indexes in the κ-CGN group. (D) Correlation analysis of characteristic microbiota and biochemical indexes in the κ-CC group. The color scale represents the strength of correlation, ranging from 0.5 (strong positive correlation) to − 0.5 (strong negative correlation). * p < 0.05, ** p < 0.01.
Figure 7
Figure 7
Schematic diagram of κ-CGN solution and κ-CC causing microbiota changes in mice. (The arrows indicate upward and downward changes in microbiota or physiological indicators.)

Similar articles

Cited by

References

    1. Campo V.L., Kawano D.F., Silva D.B.D., Carvalho I. Carrageenans: Biological properties, chemical modifications and structural analysis–A review. Carbohydr Polym. 2009;77:167–180. doi: 10.1016/j.carbpol.2009.01.020. - DOI
    1. Li L., Ni R., Shao Y., Mao S. Carrageenan and its applications in drug delivery. Carbohydr. Polym. 2014;103:1–11. doi: 10.1016/j.carbpol.2013.12.008. - DOI - PubMed
    1. Bhattacharyya S., Liu H., Zhang Z., Jam M., Dudeja P.K., Michel G., Linhardt R.J., Tobacman J.K. Carrageenan-induced innate immune response is modified by enzymes that hydrolyze distinct galactosidic bonds. J. Nat. Biochem. 2010;21:906–913. doi: 10.1016/j.jnutbio.2009.07.002. - DOI - PMC - PubMed
    1. Błaszak B., Gozdecka G., Shyichuk A. Carrageenan as a functional additive in the production of cheese and cheese-like products. Acta Sci. Pol. Technol. Aliment. 2018;17:107–116. doi: 10.17306/j.Afs.2018.0550. - DOI - PubMed
    1. Tobacman J.K. Review of harmful gastrointestinal effects of carrageenan in animal experiments. Environ. Health Perspect. 2001;109:983–994. doi: 10.1289/ehp.01109983. - DOI - PMC - PubMed

LinkOut - more resources