

Effects of Pile-Fermentation Duration on the Taste Quality of Single-Cultivar Large-Leaf Dark Tea: Insights from Metabolomics and Microbiomics
- PMID: 40002114
- PMCID: PMC11854364
- DOI: 10.3390/foods14040670
Effects of Pile-Fermentation Duration on the Taste Quality of Single-Cultivar Large-Leaf Dark Tea: Insights from Metabolomics and Microbiomics
Abstract
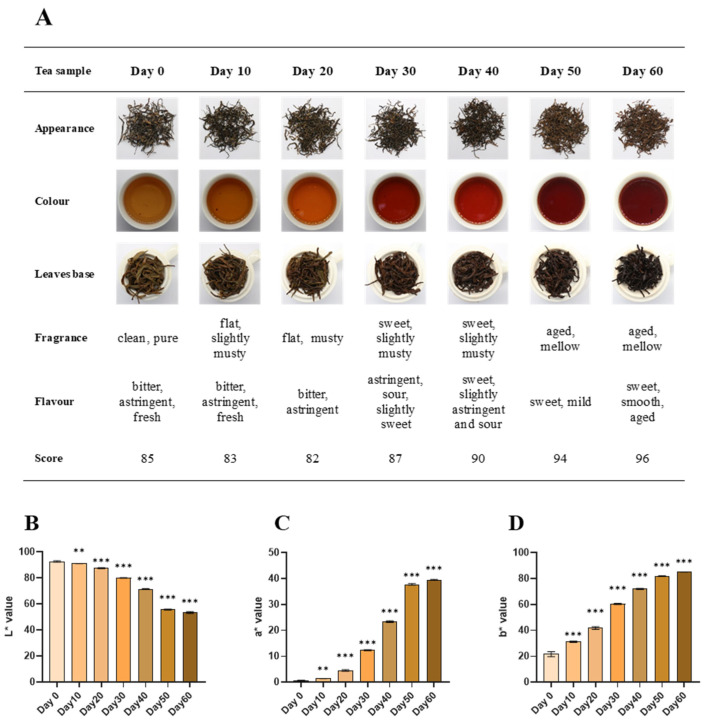
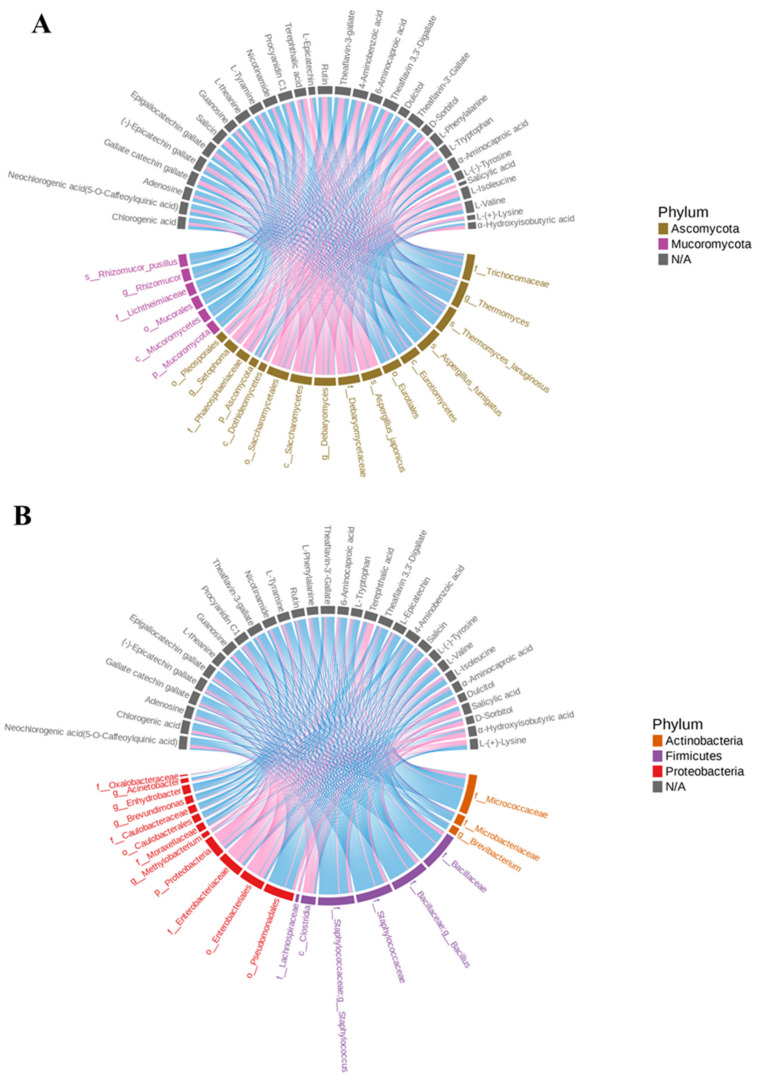
The pile-fermentation conditions and raw materials used play a vital role in determining the stability and quality of dark tea. In this study, sensory quality evaluation, metabolomics, and microbiomics techniques were used to investigate the effect of pile-fermentation duration on the taste quality of single-cultivar large-leaf dark tea (SLDT) and its underlying metabolite and microbial mechanisms. The study revealed that a 60-day duration resulted in a better SLDT sensory quality, with astringency and bitterness significantly reduced and sweetness increased. Catechins and theaflavins with ester structures, L-epicatechin, methyl gallate, protocatechuic acid, gallic acid, salicin, chlorogenic acid, and neochlorogenic acid were key taste metabolites contributing to the reduction of astringency and bitterness. Salicylic acid and D-sorbitol helped form the sweetness. Correlation analysis found out Aspergillus, Thermomyces, Bacillus, Staphylococcus, and Micrococcaceae were core functional microorganisms linked to these metabolites, helping to foster the higher quality of SLDT. Microorganisms shaped the taste quality of SLDT through metabolic processes and enzyme secretion during pile-fermentation. This study provided insights into the metabolite basis and microbiological mechanisms of SLDT taste formation and offered guidance for optimizing production processes to improve the stability and quality of dark tea.
Keywords: dark tea; metabolomics; microbiomics; pile-fermentation; quality; taste.
Conflict of interest statement
The authors declare no conflicts of interest.
Figures

Similar articles
-
Key Metabolites Influencing Astringency and Bitterness in Yinghong 9 Large-Leaf Dark Tea Before and After Pile-Fermentation.J Agric Food Chem. 2024 Dec 11;72(49):27378-27388. doi: 10.1021/acs.jafc.4c07851. Epub 2024 Nov 27. J Agric Food Chem. 2024. PMID: 39604007
-
Determination of the variations in the metabolic profile and sensory quality of Liupao tea during fermentation through UHPLC-HR-MS metabolomics.Food Chem. 2023 Mar 15;404(Pt B):134773. doi: 10.1016/j.foodchem.2022.134773. Epub 2022 Oct 29. Food Chem. 2023. PMID: 36332583
-
Exploring core functional fungi driving the metabolic conversion in the industrial pile fermentation of Qingzhuan tea.Food Res Int. 2024 Feb;178:113979. doi: 10.1016/j.foodres.2024.113979. Epub 2024 Jan 4. Food Res Int. 2024. PMID: 38309920
-
Regulation of fungal community and the quality formation and safety control of Pu-erh tea.Compr Rev Food Sci Food Saf. 2022 Nov;21(6):4546-4572. doi: 10.1111/1541-4337.13051. Epub 2022 Oct 6. Compr Rev Food Sci Food Saf. 2022. PMID: 36201379 Review.
-
Metabolic function and quality contribution of tea-derived microbes, and their safety risk in dark tea manufacture.Food Chem. 2025 Feb 1;464(Pt 2):141818. doi: 10.1016/j.foodchem.2024.141818. Epub 2024 Oct 28. Food Chem. 2025. PMID: 39486219 Review.
References
-
- Lin F., Wei X., Liu H., Li H., Xia Y., Wu D., Zhang P., Gandhi G.R., Li H.-B., Gan R. State-of-the-art review of dark tea: From chemistry to health benefits. Trends Food Sci. Technol. 2021;109:126–138. doi: 10.1016/j.tifs.2021.01.030. - DOI
-
- Wen S., Bai S., An R., Peng Z., Chen H., Jiang R., Ouyang J., Liu C., Wang Z., Ou X., et al. Key Metabolites Influencing Astringency and Bitterness in Yinghong 9 Large-Leaf Dark Tea Before and After Pile-Fermentation. J. Agric. Food Chem. 2024;72:27378–27388. doi: 10.1021/acs.jafc.4c07851. - DOI - PubMed
-
- Li Y., Hao J., Zhou J., He C., Yu Z., Chen S., Chen Y., Ni D. Pile-fermentation of dark tea: Conditions optimization and quality formation mechanism. LWT. 2022;166:113753. doi: 10.1016/j.lwt.2022.113753. - DOI
Grants and funding
- 2021ZDZX002/Qingyuan Science and Technology Plan Projects
- 2022A1515110190, 2023A1515010264, 2024A1515010696/Guangdong Basic and Applied Basic Research Foundation
- 20212100005, 202201011455, 2023E04J0781/Guangzhou Science and Technology Plan Projects
- R2021YJ-YB3014/Special fund project for introduction of scientific and technological talents of Guangdong Academy of Agricultural Sciences
- R2022PY-QY010/Special fund for scientific innovation strategy-construction of high level Academy of Agriculture Science
LinkOut - more resources
Full Text Sources
