. 2025 Feb 8;17(4):587.
doi: 10.3390/cancers17040587.

WBP5 Expression Influences Prognosis and Treatment Response in Head and Neck Squamous Cell Carcinoma

Affiliations

WBP5 Expression Influences Prognosis and Treatment Response in Head and Neck Squamous Cell Carcinoma

Eun-Jeong Jeong et al. Cancers (Basel). .

Erratum in

Abstract

Objectives: Head and neck squamous cell carcinoma (HNSCC) is characterized by complex genetic alterations. This study aimed to identify WBP5 as a promising therapeutic target and evaluate the effect of WBP5 expression on prognosis and treatment response in HNSCC.

Methods: Publicly available datasets were comprehensively analyzed to investigate WBP5 expression through comprehensive bioinformatics analysis and functional validation.

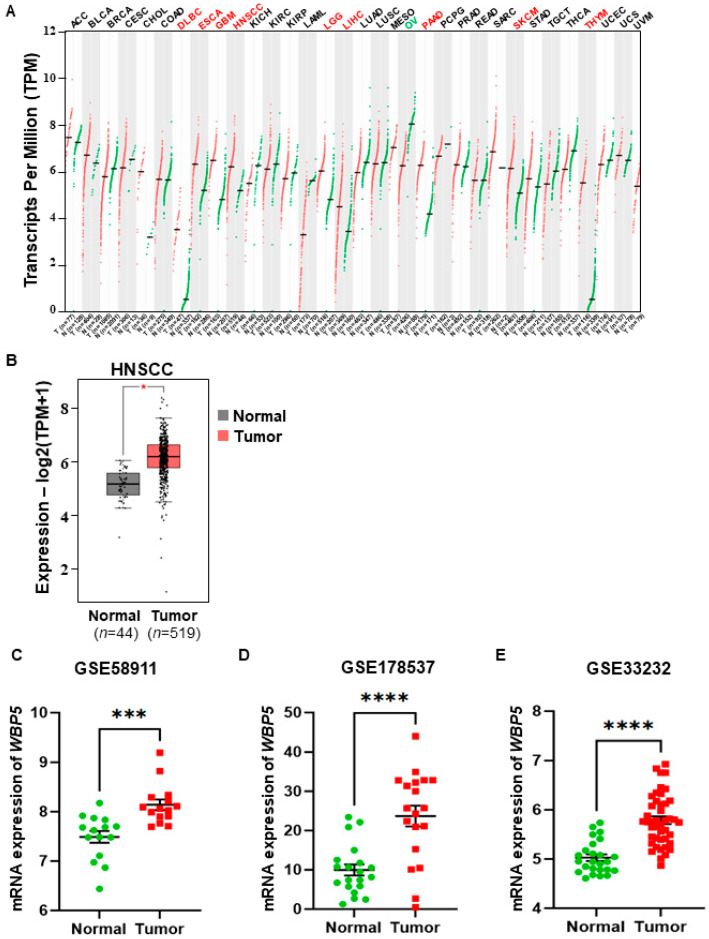
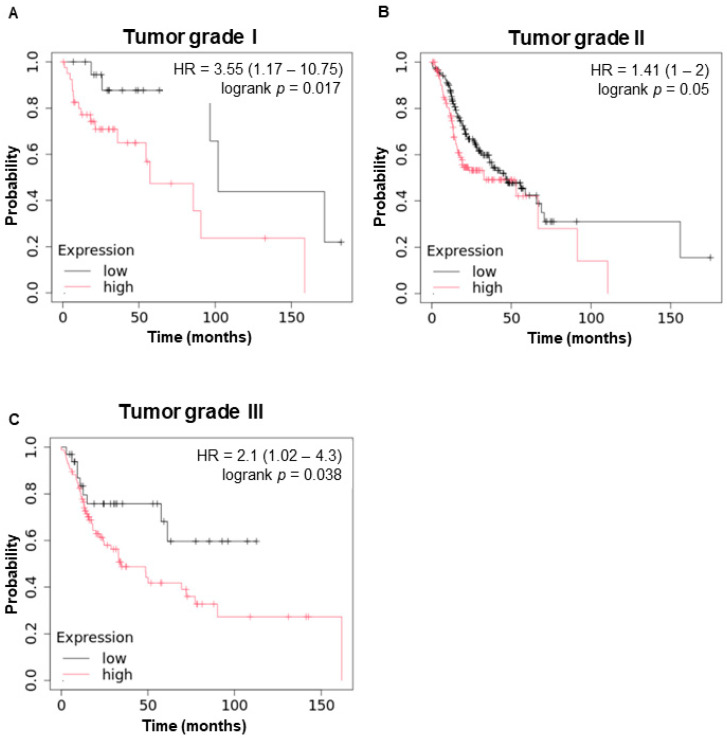
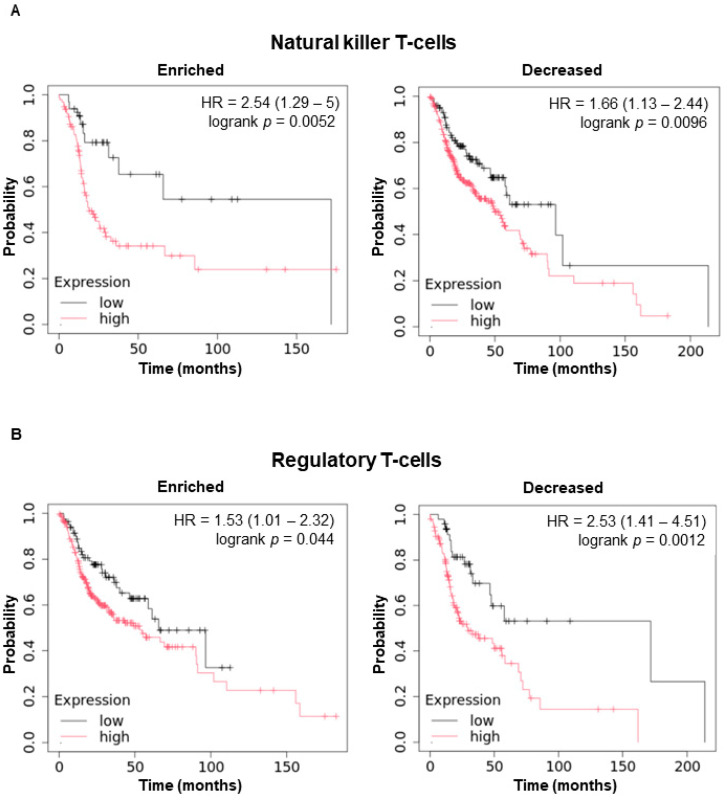
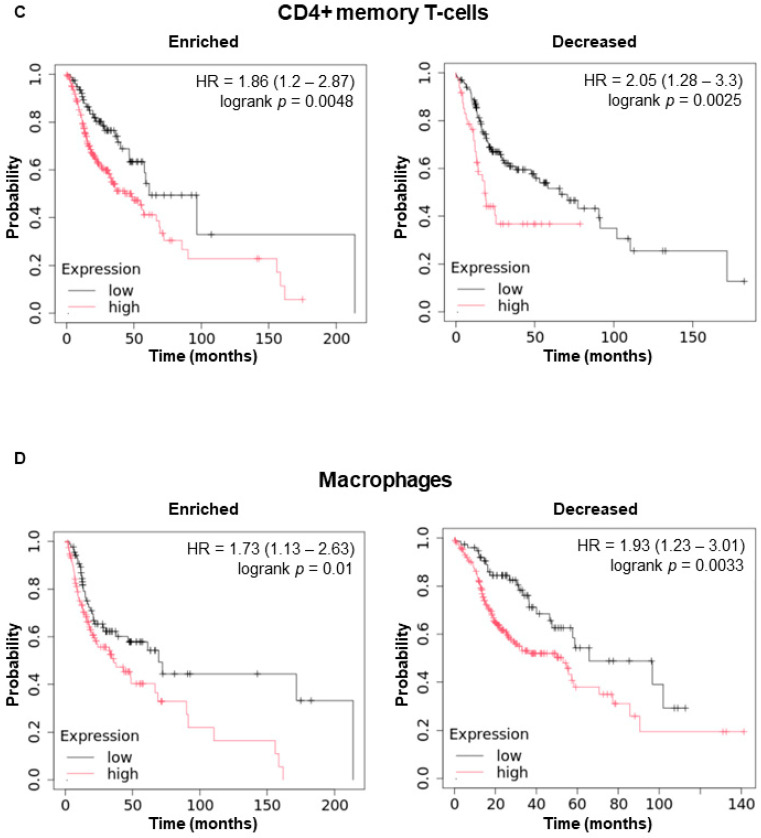
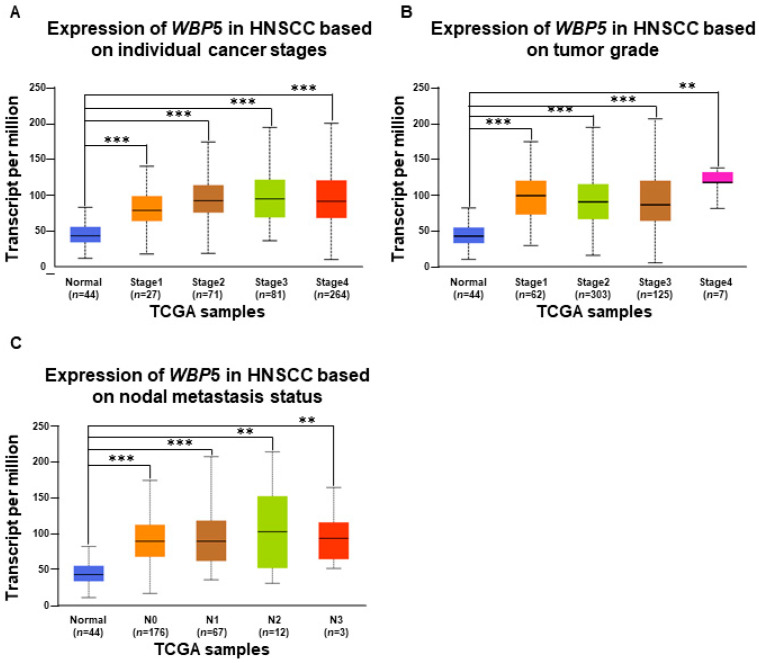
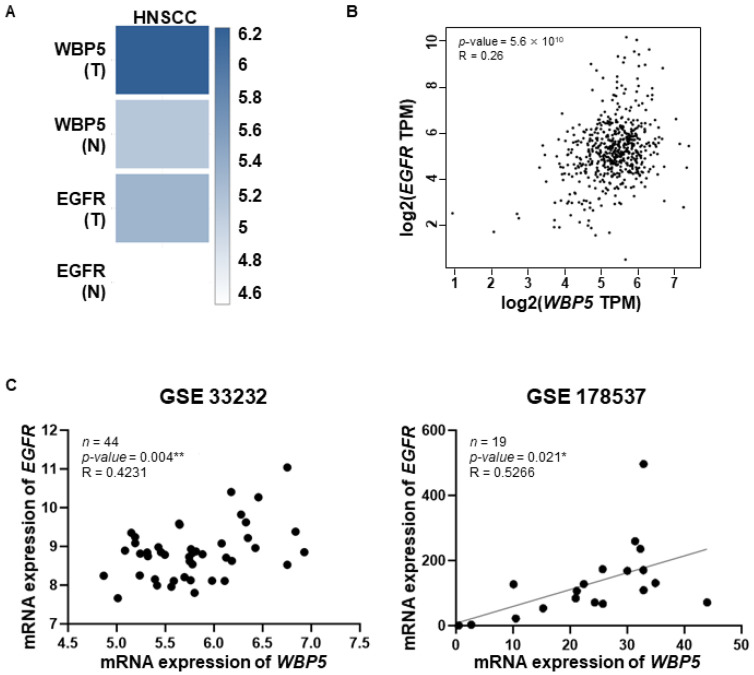
Results: WBP5 was particularly overexpressed in HNSCC, as analyzed through the Gene Expression Profiling Interactive Analysis version 2 (GEPIA2) database and validated using multiple Gene Expression Omnibus (GEO) datasets. Analysis with UALCAN confirmed that WBP5 expression was significantly higher in advanced cancer stages and tumor grades than that of normal samples. A Kaplan-Meier analysis demonstrated that patients overexpressing WBP5 had a poor prognosis. Moreover, WBP5 expression correlated with the overexpression of the epidermal growth factor receptor in HNSCC. In vitro experiments revealed that WBP5 knockdown significantly reduced FaDu cell proliferation and viability. Furthermore, silencing WBP5 enhanced cisplatin sensitivity, indicating its potential role in chemoresistance.

Conclusions: These results indicate that WBP5 could act as a prognostic marker and a viable therapeutic target in HNSCC. Modulating WBP5 expression may represent a novel strategy to enhance treatment efficacy. Future studies should elucidate the precise mechanisms of WBP5 action and develop targeted therapies. This integrated approach, combining a comprehensive analysis of publicly available datasets with in vitro experimental validation provides strong evidence for the clinical significance of WBP5 in HNSCC.

Keywords: Transcriptional Elongation Factor A-like 9 (TCEAL9); WW domain-binding protein 5 (WBP5); head and neck squamous cell carcinoma.


Conflict of interest statement

The authors declare no conflicts of interest.

Figures

Figure 1
Figure 1
Analysis of WBP5 expression in head and neck squamous cell carcinoma (HNSCC) using Gene Expression Profiling Interactive Analysis (GEPIA2). (A) WBP5 expression in various cancers. (B) WBP5 expression in HNSCC. WBP5 expression was conducted in 44 normal samples and 519 tumor samples. The gray box denotes normal samples, while the red box indicates tumor samples. * p < 0.05 (C,D) The mRNA expression levels of WBP5 were analyzed in normal and tumor tissues across multiple datasets. In each dataset, WBP5 levels were compared between normal samples (green) and tumor samples (red): (C) GSE58911, (D) GSE178537, and (E) GSE33232. A significant increase in WBP5 expression was observed in tumor samples across all datasets. Statistical significance is assessed using the appropriate test, with p-values represented as follows: **** p < 0.0001, *** p < 0.001.
Figure 2
Figure 2
Expression and prognostic significance of WBP5 in HNSCC. (A) WBP5 expression across various cancers. Heatmap depicting WBP5 expression levels, where high expression is indicated in red and low expression in blue. (B) Kaplan–Meier plot for overall survival in a specific cancer cohort, comparing high (red) and low (blue) WBP5 expression groups. Elevated WBP5 expression is strongly correlated with reduced survival rates (log-rank p = 0.0012, HR = 2.0). (C) Kaplan–Meier survival graphs displaying overall survival (left) and relapse-free survival (right) in cancer patients, stratified by high (red) and low (black) WBP5 expression levels. High expression is associated with worse overall survival (HR = 1.75, log-rank p = 0.00089) and exhibits a trend toward worse relapse-free survival (HR = 2.17, log-rank p = 0.05).
Figure 3
Figure 3
Kaplan–Meier survival curves depicting the relationship between WBP5 expression and overall survival in patients with HNSCC across different tumor grades. (A) Tumor grade I: patients with low WBP5 expression demonstrated significantly better overall survival compared to those with high expression (HR = 3.55, 95% CI: 1.17–10.75, log-rank p = 0.017). The number of patients at risk at various time points is indicated at the bottom of the plot. (B) Tumor grade II: high WBP5 expression was associated with poorer overall survival in patients with grade II head and neck cancer (HR = 1.41, 95% CI: 1.0–2), with a log-rank p of 0.05. The number of patients at risk is presented at the bottom. (C) Tumor grade III: Kaplan–Meier analysis for patients with grade III head and neck cancer indicated that those with high WBP5 expression had worse survival outcomes (HR = 2.1, 95% CI: 1.02–4.3, log-rank p = 0.038). The number of patients at risk over time is presented below the curve.
Figure 4
Figure 4
Survival plots based on the Kaplan–Meier analysis illustrating the effect of high versus low expressions of immune cell subsets on overall survival in HNSCC patients. (A) A high expression of NK T-cells was linked to poorer overall survival in both enriched (HR = 2.54, p = 0.0052) and decreased groups (HR = 1.66, log-rank p = 0.0096). (B) High Treg expression negatively impacted survival in both the enriched (HR = 1.53, log-rank p = 0.044) and decreased groups (HR = 2.53, log-rank p = 0.0012). (C) High CD4+ memory T-cell expression correlated with worse survival in enriched (HR = 1.86, log-rank p = 0.0048) and decreased groups (HR = 2.05, log-rank p = 0.0025). (D) High macrophage expression was associated with reduced survival in the enriched (HR = 1.73, log-rank p = 0.01) and decreased groups (HR = 1.93, log-rank p = 0.0033).
Figure 4
Figure 4
Survival plots based on the Kaplan–Meier analysis illustrating the effect of high versus low expressions of immune cell subsets on overall survival in HNSCC patients. (A) A high expression of NK T-cells was linked to poorer overall survival in both enriched (HR = 2.54, p = 0.0052) and decreased groups (HR = 1.66, log-rank p = 0.0096). (B) High Treg expression negatively impacted survival in both the enriched (HR = 1.53, log-rank p = 0.044) and decreased groups (HR = 2.53, log-rank p = 0.0012). (C) High CD4+ memory T-cell expression correlated with worse survival in enriched (HR = 1.86, log-rank p = 0.0048) and decreased groups (HR = 2.05, log-rank p = 0.0025). (D) High macrophage expression was associated with reduced survival in the enriched (HR = 1.73, log-rank p = 0.01) and decreased groups (HR = 1.93, log-rank p = 0.0033).
Figure 5
Figure 5
Analysis of WBP5 expression in HNSCC across cancer stages, tumor grade, and nodal metastasis status. (A) Box plot depicting WBP5 expression levels across HNSCC stages (from 1 to 4) versus normal tissue, based on TCGA samples. Expression significantly increases with cancer stage, peaking at Stage 4 (*** p < 0.001, ** p < 0.01). (B) Box plot of WBP5 expression across tumor grades (from 1 to 4) compared to normal tissue, exhibiting higher expression in higher-grade tumors, especially Grade 4 (*** p < 0.001, ** p < 0.01). (C) Box plot illustrating WBP5 expression by nodal metastasis status (N0 to N3). Significant expression increases in N1 and N2, with a decrease in N3 (*** p < 0.001 and ** p < 0.01).
Figure 6
Figure 6
Correlation of WBP5 and EGFR expression across different cancer types and datasets. (A) Heatmaps of WBP5 and EGFR expression across HNSCC, with darker blue indicating higher expression levels. (B) Scatter plot showing the correlation between WBP5 and EGFR expression (log2 TPM) across samples, with a positive correlation (R = 0.26, p = 5.6 × 10¹⁰). (C) Scatter plots showing the correlation between WBP5 and EGFR expression in specific datasets (GSE33232 and GSE178537). Both datasets demonstrate a positive correlation between WBP5 and EGFR expression, with GSE33232 (R = 0.4231, p = 0.004) and GSE178537 (R = 0.5266, p = 0.021) (* p < 0.05 and ** p < 0.01).
Figure 7
Figure 7
Knockdown of WBP5 reduces cell proliferation and enhances sensitivity to cisplatin in HNSCC cells. (A) WBP5 mRNA levels are significantly downregulated in siWBP5-transfected cells compared to NC (*** p < 0.001). (B) Cell proliferation is significantly reduced in siWBP5 cells over 1, 3, and 5 days compared to NC (*** p < 0.001). (C) Cell viability decreases with increasing cisplatin concentrations, with a greater reduction in siWBP5 cells (*** p < 0.001). (D) Caspase 3/7 activity is higher in siWBP5 cells, especially after 1 μM cisplatin treatment, indicating increased apoptosis (*** p < 0.001). (E) Clonogenic assay results showing colony formation in NC- and siWBP5-treated cells with 0µM and 1µM cisplatin. siWBP5-treated cells demonstrate reduced colony formation, particularly with cisplatin exposure. Quantification is presented on the right (*** p < 0.001).

Similar articles

Cited by

References

    1. Lee A.M., Weaver A.N., Acosta P., Harris L., Bowles D.W. Review of Current and Future Medical Treatments in Head and Neck Squamous Cell Carcinoma. Cancers. 2024;16:3488. doi: 10.3390/cancers16203488. - DOI - PMC - PubMed
    1. Shah P.A., Huang C., Li Q., Kazi S.A., Byers L.A., Wang J., Johnson F.M., Frederick M.J. NOTCH1 Signaling in Head and Neck Squamous Cell Carcinoma. Cells. 2020;2:2677. doi: 10.3390/cells9122677. - DOI - PMC - PubMed
    1. Ward C., Cauchy P., Garcia P., Frampton J., Esteban M.A., Volpe G. High WBP5 expression correlates with elevation of HOX genes levels and is associated with inferior survival in patients with acute myeloid leukaemia. Sci. Rep. 2020;10:3505. doi: 10.1038/s41598-020-60480-x. - DOI - PMC - PubMed
    1. Tang R., Lei Y., Hu B., Yang J., Fang S., Wang Q., Li M., Guo L. WW domain binding protein 5 induces multidrug resistance of small cell lung cancer under the regulation of miR-335 through the Hippo pathway. Br. J. Cancer. 2016;115:243–251. doi: 10.1038/bjc.2016.186. - DOI - PMC - PubMed
    1. Gylfe A.E., Kondelin J., Turunen M., Ristolainen H., Katainen R., Pitkanen E., Kaasinen E., Rantanen V., Tanskanen T., Varjosalo M., et al. Identification of candidate oncogenes in human colorectal cancers with microsatellite instability. Gastroenterology. 2013;145:540–543.e522. doi: 10.1053/j.gastro.2013.05.015. - DOI - PubMed

LinkOut - more resources